Here's a fact that surprises many retirees: for every $1,000 in assets above the threshold, your Age Pension is reduced by $3 per fortnight - that's $78 per year. This taper rate applies to both singles and couples (though couples have a higher threshold before the taper kicks in). It creates some counterintuitive effects on retirement planning.
Important clarification: More savings ALWAYS means more total income. The taper trap isn't about having less - it's about the diminishing marginal value of additional savings. Each extra $1,000 in assets gives you less and less additional income.
Get Your Free Retirement Readiness Checklist
A quick 15-point checklist to see if you're on track. Plus weekly tips on super, Age Pension, and retirement planning.
No spam. Unsubscribe anytime.
What is the Age Pension Taper Trap in Australia?
The Age Pension Taper Trap is a financial threshold where the Age Pension reduces by $3.00 per fortnight for every $1,000 of assets over the limit. This creates a "trap" where retirees with more assets can end up with a lower total income (pension plus drawdowns) than those with fewer assets due to the steep reduction in government support.
| Asset Level (Couple/Homeowner) | Fortnightly Pension | Effective Loss |
|---|---|---|
| $470,000 | Full Pension | $0 |
| $500,000 | Reduced Pension | −$90 / fortnight |
| $600,000 | Reduced Pension | −$390 / fortnight |
While the math seems simple, our Advanced Calculator identified that for a couple with $550k in assets, the "hidden" tax on their savings effectively exceeds 7%.
How the Taper Works
The Age Pension uses an assets test with these thresholds (from 20 March 2026, homeowner):
| Situation | Full Pension Threshold | Cut-off (No Pension) |
|---|---|---|
| Single, homeowner | $327,000 | $722,000 |
| Couple, homeowner | $490,500 | $1,085,000 |
| Single, non-homeowner | $590,000 | $990,000 |
| Couple, non-homeowner | $753,500 | $1,356,500 |
Calculate Your Retirement Needs Now
Enter your details and see exactly how much super you need. Our calculator uses real market data from 1928, tests against historical crashes, and integrates Age Pension calculations.
Run the 60-Second Stress-TestNo signup required - Instant results - 100% private
The Diminishing Returns Problem
The taper doesn't mean you're worse off with more assets. It means the BENEFIT of each additional dollar is reduced, and in the taper zone, you can actually have a NET COST in year one:
- Below threshold: Extra $10,000 earns 5% in investment returns = $500/year benefit
- In taper zone: Extra $10,000 earns 5% ($500) but pension drops $780 = -$280/year NET COST in year one (you're worse off initially)
- But over time: As you draw down that $10,000, your pension gradually increases again. The lifetime benefit is still positive because you have more assets to draw from over your entire retirement.
The lifetime benefit of that extra $10,000 is still positive - you're always better off with more over the long term. But in year one, you actually have a net cost because the pension reduction ($780) exceeds the investment earnings ($500). This reverses as you draw down the assets.
The 7.8% Forced Drawdown Trap - This Will Shock You
Here's the brutal math that most retirees don't understand: the taper rate of $78 per $1,000 is effectively a 7.8% annual penalty on your assets in the taper zone.
If your super is earning less than 7.8% (which is most retirees, especially those in conservative or balanced funds), the pension reduction exceeds your investment returns. This means you're forced to spend down your super principal just to maintain the same income level - the taper is literally eating into your savings, not just your returns.
Example: A retiree with $500,000 in super earning 5% gets $25,000 in returns. But if they're in the taper zone, they lose $39,000 in pension ($78 - 500). Their $25,000 in returns doesn't even cover half the pension loss - they must draw down $14,000 from principal just to break even. This is why the taper zone is so punishing for retirees with moderate returns.
Are You in the Taper Trap?
Don't guess - calculate your exact pension reduction and see if you're in the forced drawdown trap. Our calculator shows you the year-by-year impact with real numbers.
Run the 60-Second Stress-TestNo signup required - Instant results - 100% private
Example: Why More Assets Still Wins Over Time
Consider two retirees at age 67:
Retiree A: $400,000 super. Reduced pension now, but as they draw down super, pension increases. By age 80, super is depleted and they receive full pension.
Retiree B: $600,000 super. Even more reduced pension now, but more super income. As they draw down, pension gradually increases. They have higher total income every single year.
The key insight: Retirement is dynamic. Your super balance falls over time, and as it falls, your pension rises. Someone with $600K will ALWAYS have more total income than someone with $400K - they just draw from super longer before transitioning to full pension.
The Real Trap: Making Poor Decisions
The trap isn't that saving is bad - more savings ALWAYS means more lifetime income. The trap is:
- Spending down assets just to get more pension (you'll have less total income)
- Not understanding the dynamic: Your pension will increase as you draw down super
- Ignoring optimisation: Some assets are exempt or treated favourably
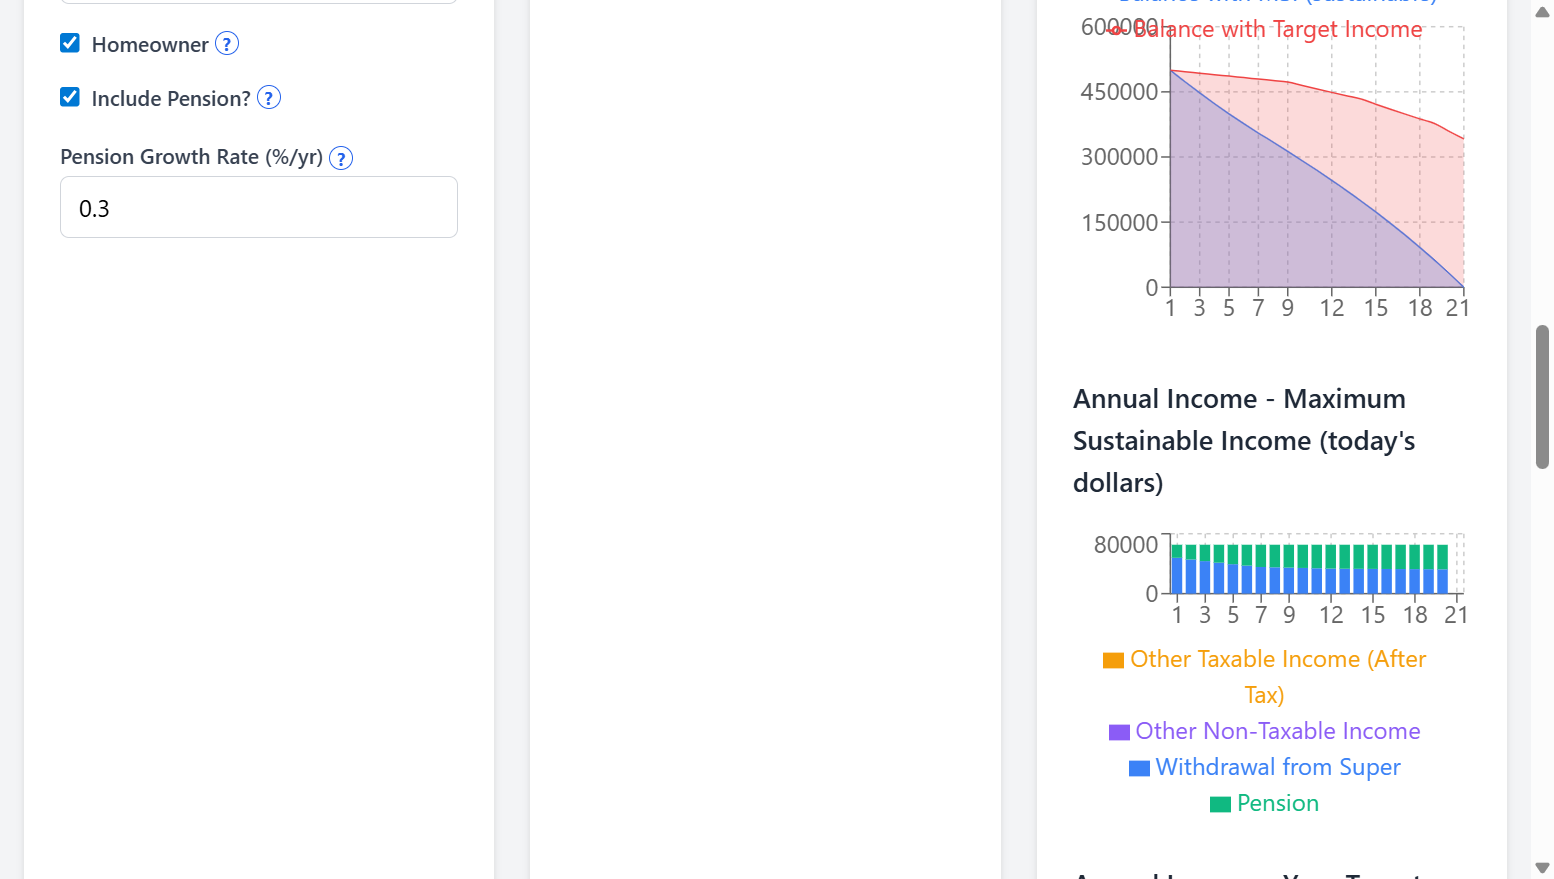
Retirement calculator showing how Age Pension (green) increases as super withdrawals (blue) decrease over time
Strategies for the Taper Zone
- Don't spend down just for pension: You're always better off with more assets
- Consider exempt assets: Your home, some funeral bonds, and certain annuities don't count
- Gifting rules: You can gift $10,000/year ($30,000 over 5 years) to reduce assessable assets
- Lifetime annuities: Some complying products receive favourable asset test treatment; the exact treatment depends on product type and when purchased (rules have changed)
Key insight: The taper zone is between roughly $300K and $670K for singles under current thresholds. Above the cut-off, additional assets are no longer reducing pension under the assets test; below the lower threshold, you receive the full pension (subject to the income test). Understanding where you sit along this range can help frame discussions with a licensed adviser about how different choices might affect your total income over time.
The Taper Trap Quick Reference Guide
Complete 2-page guide with formulas, examples, and the 7.8% penalty breakdown. See exactly how the taper trap affects your retirement income.
Download Free PDF GuideEscape the Taper Trap
The 7.8% forced drawdown is brutal. But there are strategies: timing withdrawals, strategic spending, home renovations, funeral bonds. Model your exact situation and find the optimal path through the taper zone.
Run the 60-Second Stress-TestDisclaimer: This article is for informational purposes only. Consult a licensed financial adviser for advice specific to your circumstances.