Important Disclaimer: This article is for educational and informational purposes only. It does not constitute financial product advice, personal financial advice, or a recommendation. SuperCalc Pro is not licensed to provide financial advice under Australian law. Past performance does not guarantee future results. The examples provided are hypothetical and for illustration only. You should consult a licensed financial adviser (AFSL holder) for advice specific to your personal circumstances, objectives, financial situation, and needs. Always read the Product Disclosure Statement (PDS) and consider your own circumstances before making any financial decisions.
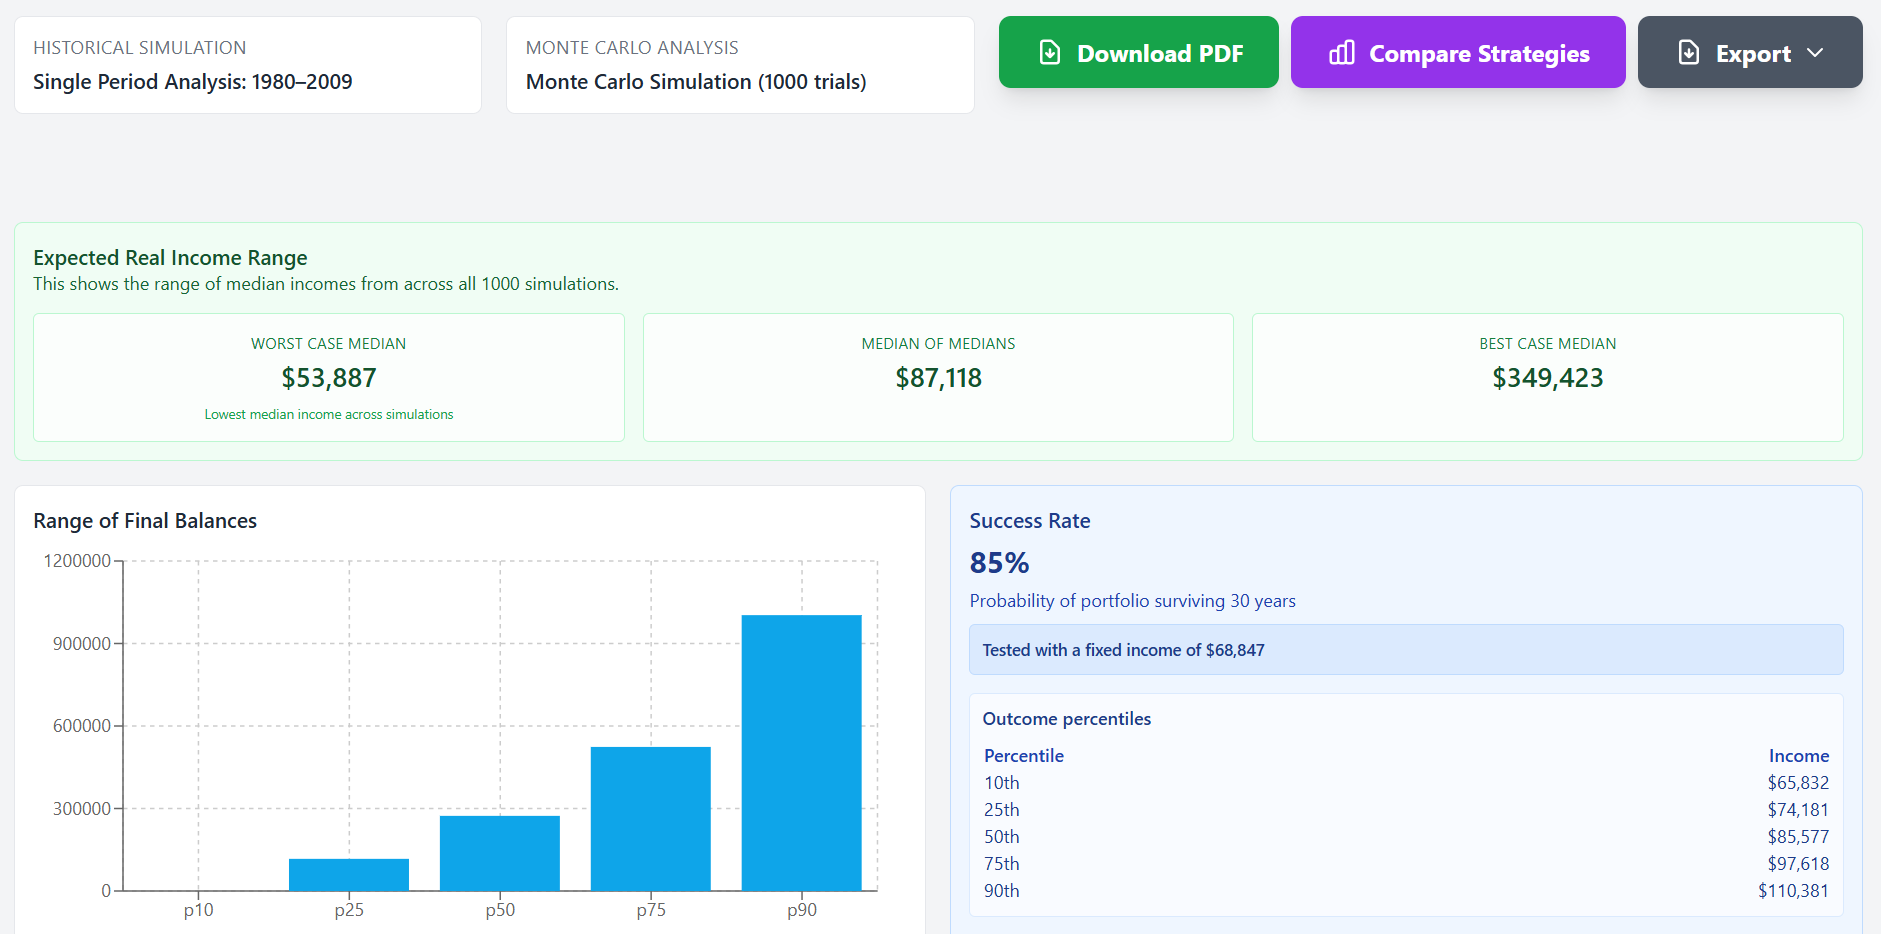
Monte Carlo simulations are widely used in retirement planning. "You have an 85% success rate!" the calculator tells you. It sounds scientific, precise, and reassuring. After all, it's run 10,000 simulations of your future. How could that be wrong?
Here's the problem: Monte Carlo simulations assume that markets are random. Each year's return is independent of the last, like flipping a coin. But anyone who's watched markets knows this isn't true. Markets have cycles. Crashes are followed by recoveries. Extended booms are followed by corrections.
This article explains how Monte Carlo simulations work, their underlying assumptions, and how they compare to historical backtesting methods. Understanding these differences can help you better interpret the results you see from retirement planning tools.
Monte Carlo creates imaginary disaster scenarios that have never occurred in 98 years of market data. These imaginary failures drag down your "success rate" even though they've never happened and likely never will. Historical data shows what actually survived, and it's often more optimistic than Monte Carlo.
How Monte Carlo Simulations Work
Monte Carlo simulations generate thousands of random scenarios based on statistical distributions. They'll show you a success rate, "You have an 85% chance of success", along with a probability distribution chart showing the range of possible outcomes. Many tools recommend a withdrawal rate, usually something like 4% to be safe. They'll calculate how much you might need to save, perhaps $1.5 million to retire comfortably.
It all sounds scientific and precise. But it's built on a foundation of assumptions that don't match reality.

The Limitations of Monte Carlo
Monte Carlo simulations can generate scenarios with 15 or 20 consecutive years of negative returns, something that's never happened. They can create never-ending bear markets, even though markets have historically recovered. They can show crashes without recoveries, even though every crash in history has eventually recovered. They generate random sequences that don't reflect how markets actually behave.
These imaginary scenarios count as "failures" in Monte Carlo, even though they've never occurred in 98 years of data.
The Fatal Flaw: Markets Aren't Random
Monte Carlo assumes each year's return is completely independent of the previous year. There are no patterns, no cycles, no mean reversion. A crash can be followed by another crash, or a boom can be followed by another boom, it's all random.
But reality tells a different story. After every major crash in history, 1929, 1973, 1987, 2000, 2008, 2020, markets recovered. Not immediately, but they recovered. Extended bear markets are followed by bull markets. This isn't random; it's the fundamental nature of how markets work.
Monte Carlo can generate scenarios with 15 or 20 consecutive years of negative returns. This has never happened in 98 years of market data. These imaginary disaster scenarios drag down your "success rate" even though they've never occurred and likely never will.
Hypothetical Example: Comparing Methods
Let's look at a hypothetical example to illustrate the difference. Consider a couple both aged 67. One partner has $1 million in super, the other has none. They're considering spending $70,128 per year for a 30-year retirement.

What Monte Carlo Might Show
Monte Carlo simulation might show a success rate of 85%. Some tools might suggest reducing spending to $65,000 per year to be safer. There's an 11% chance of failure, according to the simulation.
This hypothetical couple might be concerned. They thought they'd saved enough. The recommendation to reduce spending might make them anxious about their retirement.
What Historical Backtesting Shows
Historical backtesting with the same inputs shows different results. The worst-case income comes out at $72,180 per year, and that survived even 1929. The average income across all periods is $96,936 per year. The best case, during the 1980s bull market, was $131,828 per year. At the target income of $70,128, the historical success rate is 100%.
In this hypothetical example, the target income of $70,128 is actually below the historical worst case. Monte Carlo's 85% success rate suggests risk for a plan that has never failed historically.
The gap is stark. Monte Carlo says 85% success rate, meaning an 11% chance of failure. But historically, this exact income level succeeded in every single period since 1929. Monte Carlo is suggesting there's an 11% chance of failure for a plan that has never failed historically.
That 11% "failure rate" in Monte Carlo comes from imaginary disaster scenarios that have never occurred in real markets. Random sequences of returns that don't reflect how markets actually behave. This illustrates why understanding the methodology matters when interpreting results.
Monte Carlo: 85% success. Historical reality: 100% success. Test your retirement against 98 years of real crashes, not random simulations. Run historical backtesting →
Why Monte Carlo Is Widely Used
There are structural reasons why the financial planning industry has embraced Monte Carlo despite its limitations.
For starters, it sounds sophisticated. "We ran 10,000 simulations" has a mathematical, scientific appearance that's compelling. The numbers look authoritative and scientific.
There's also a conservative bias that seems prudent. Conservative projections can appear responsible, even when they may be unnecessarily pessimistic.
It's also standard practice. Monte Carlo is built into all major financial planning software. It's what everyone uses, so it becomes the default methodology.
Just because a tool is widely used doesn't mean it's perfect. The industry standard tool has a fundamental flaw, it assumes randomness that doesn't exist in real markets.
What Historical Data Actually Shows
Historical backtesting takes a completely different approach. Instead of generating random scenarios, it tests your exact plan against actual historical periods. What would have happened if you retired in 1928? In 1929? In 1966? In 1982? We test every starting year and see which periods survived and which failed.

This approach uses real data with real sequences and real recoveries. You learn exactly which historical periods would have been challenging, which would have been comfortable, and what sustainable income level works across all periods.

Head-to-Head Comparison
| Factor | Monte Carlo Simulation | Historical Backtesting |
|---|---|---|
| Data source | Random generation | Actual 1928-2025 data |
| Assumes | Markets are random | Markets have patterns |
| Crash recovery | Maybe, maybe not | Always (historically) |
| Worst case | Imaginary scenarios | Real worst periods |
| Success rate | 85% (includes imaginary failures) | 100% (worst-case income) |
| Actionable insight | "85% success", now what? | "Worst case = $X/year", clear target |
Understanding Different Analysis Methods
When reviewing retirement projections, it's helpful to understand what methodology is being used. Some tools use Monte Carlo, others use historical backtesting, and some offer both.
Historical backtesting shows how a plan would have performed in actual historical periods. It tests against real market sequences, including crashes like 1929, 1973, and 2008, to see what actually survived.
If a tool shows both Monte Carlo and historical analysis, you can compare them side-by-side. If Monte Carlo says 85% success but historical data shows 100% survival for the same plan, the difference comes from Monte Carlo's imaginary scenarios that have never occurred.
Understanding these differences helps you interpret the results you see. Historical data shows what actually happened in past market conditions. Monte Carlo shows what might happen if markets behaved randomly, which they don't.