Every few months another report lands with the same moral. Australians are not saving enough. The system is broken. A generation will work until they drop. The charts usually compare a headline lump sum for a “comfortable” retirement with an average or median super balance and declare a crisis. The shortfalls on those charts are often real. The leap from a shortfall chart to a single national verdict is where the story usually overreaches.
Australia already runs a two-pillar model for most retirees: compulsory super plus a means-tested Age Pension. That blend is a policy choice, not a law of nature. Indexation rules, means-testing settings, and the willingness to fund a rising retiree cohort can change. Under today’s settings, though, judging adequacy by super alone invents shortfalls the pension was designed to cover, while ignoring rent, interrupted careers, and early exit before 67 hides the households that really are thin. The useful question is narrower: how much super, for whom, under which living standard, with which housing status.
If you arrived from a plain “how much do I need?” search and are not yet fluent in ASFA’s labels, start with how much super you need to retire in Australia. That guide walks the household budgets and lump sums first. This piece is the follow-on: what those benchmarks look like next to real median balances, and which cohorts the crisis headlines actually describe.
What the balance data actually shows
The ATO’s Taxation Statistics 2023-24 are the cleanest public snapshot of individual account balances. Among people with a positive balance or current-year contributions, the all-ages median sits around $63,000. That figure is almost useless for retirement planning because it mixes 22-year-olds with 70-year-olds. Age bands matter.
The ATO’s combined (persons) figures put the median at about $203,000 for ages 60-64 and about $219,000 for ages 65-69. Headline Chart 12 on the same page splits those bands by sex, so a reader skimming only the chart can miss the persons totals. Means in the same bands sit near $371,000 and $437,000 because a minority of large balances pulls the average up. When a newspaper quotes “average super near retirement,” check whether it is using the mean. For a typical household, the median is the fairer benchmark.
Those medians are for individuals. Two accounts at about the 60-64 persons median ($203,000 each) sum to about $406,000 before any home equity. That combined figure is still far short of ASFA’s comfortable couple lump sum, and much closer to ASFA’s modest couple buffer once the full Age Pension is on the table.
ASFA budgets versus ASFA lump sums
The Association of Superannuation Funds of Australia publishes the Retirement Standard each quarter. In plain terms, “comfortable” means private health, a car, some travel; “modest” is basics with little discretionary spend. For March quarter 2026, homeowner budgets for ages 65-84 look like this:
| Lifestyle | Single (annual) | Couple (annual) |
|---|---|---|
| Comfortable | $55,923 | $78,566 |
| Modest | $36,434 | $52,473 |
| Modest (renting) | $51,164 | $69,002 |
ASFA also publishes lump-sum estimates that assume retirement around 67, home ownership, drawdown of capital, and Age Pension support. Comfortable targets sit at $630,000 for a single and $730,000 for a couple. Modest targets are only $110,000 and $120,000. The modest numbers look almost absurdly low until you remember what they are doing: they assume the Age Pension carries most of the lifestyle, and super tops up the gap.
Treating $700,000-plus as the national pass mark collapses several assumptions into one poster number: comfortable spending, home ownership, retirement near 67, and a continuing part Age Pension. Plenty of households never aimed at that standard. Plenty of others cannot reach it without working longer, spending less, or changing housing. Calling every gap below $730,000 a national crisis flattens those differences.
Replacement rates get misused the same way. A rule of thumb that you need 70% of final salary forever ignores that mortgage repayments often stop, children leave home, and the Age Pension replaces part of wages for eligible households. For a homeowner couple on a modest budget, the pension alone is already in the same ballpark as ASFA’s modest annual figure. Super is then a buffer and a lifestyle upgrade, not the entire income engine.
Who looks okay on the numbers
On the published ASFA arithmetic, a homeowner household that can wait until Age Pension age and keep spending near the modest standard does not need a comfortable-sized lump sum. The modest couple buffer is only $120,000 precisely because the full pension is assumed to do most of the work. Means testing still bites while balances stay high, then eases as they fall, which is why a static “need $X forever from super alone” model overstates required balances for many part-pensioners budgeting near modest. The true cost of retirement simulations on this site show the same mechanism on historical paths once Age Pension is modelled year by year.
That is a modelling point about how the current rules interact when the spending target matches the modest budget. It is not a claim that the same near-median balances clear ASFA’s comfortable couple spend, and it is not a census of how many couples survive health shocks, bridge years, or bad sequences. Population shares for those outcomes need a different dataset than ASFA budgets and ATO medians.
Younger workers also have a structural tailwind the crisis pieces sometimes skip. The Superannuation Guarantee is now 12%. Cohorts who spend a full career at or near that rate will retire with higher balances than people who spent decades on 3%, 9%, or stop-start contributions. ASFA has put the share of recent retirees clearing a comfortable standard around 30%, with a projection that the share can exceed 50% by 2050 as longer high-SG careers come through.
Who is genuinely at risk
Renters. Look at the table again. A modest lifestyle while renting costs a single about $51,000 a year and a couple about $69,000. That is in the same range as homeowner comfortable for a single, and it is far above the Age Pension alone. Without a home to drop out of the assets test the way an owner-occupier dwelling does, the maths get ugly fast. A “retirement crisis” framed only around super balances understates the housing crisis sitting underneath.
Early exit before 67. Preservation age can open the door at 60, but the Age Pension does not follow until 67. Those bridge years are pure private funding. A household that looks solvent at 67 can look fragile if it stops work at 60 and draws hard through the gap, even when the national median balance is unchanged.
Interrupted careers and lower lifetime earnings, which still fall harder on many women. Medians by sex in the ATO data remain uneven. Two accounts at the male median look very different from one interrupted account near the female median in the same age band. Headline “couple needs $730,000” stories that ignore who actually holds the balances miss the distribution inside the household.
Thin balances plus bad market timing. Sequence risk does not care about national averages. A household that retires into 1969 or 1973 with little spare capital discovers that the crisis is personal and path-dependent. The national debate rarely stresses that, because it is harder to put on a press release than a single shortfall number.
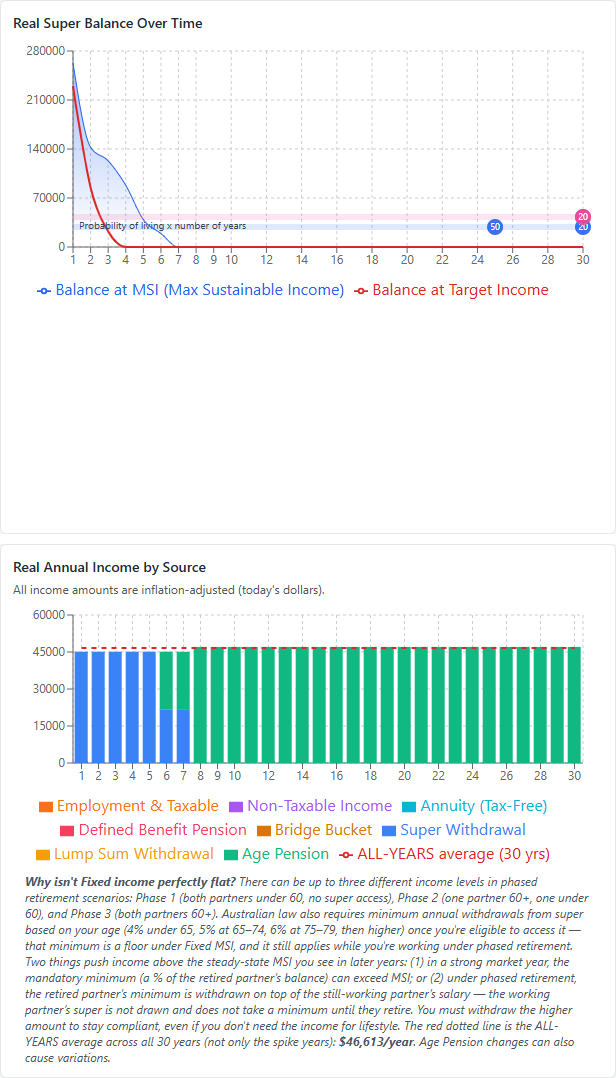
Aiming at comfortable spending on a near-median opening balance is a different test again. The worked example below is that cautionary case, not the modest-budget “okay” arithmetic above.
What the crisis language gets right
Compulsory super did not abolish poverty in old age. People without a home, without a long contribution history, or without the option to keep working face hard trade-offs. Advice is harder to access for ordinary balances after the banks pulled back from mass-market distribution. Health costs late in life are lumpy and poorly captured by a smooth ASFA budget line. Those are real policy and household problems.
The language goes wrong when it treats one comfortable lump sum as the national pass mark, confuses means with medians, and pretends the Age Pension is a footnote. Under current law, most retirees are meant to blend private savings and public income. Whether that blend stays generous enough for the next thirty years is a separate fiscal fight.
Official sources
Run the shortfall path yourself
Same near-median opening balance, comfortable spending target, harsh 1973 start. Compare the balance chart with the income chart: Age Pension can keep the lights on after super is gone, and the all-years average can still land below modest. The first Advanced runs are free. Unlimited historical runs and PDF exports are $149 a year, or $14.99 a month if you would rather not commit upfront.
Run the near-median scenario →No card required for the first run. Subscribe only if you keep using the full model.
General information only. This article is educational and does not consider your objectives, financial situation, or needs. It does not recommend that you retire, keep working, change spending, buy or sell property, or alter any super fund or product. SuperCalc Pro Pty Ltd does not hold an Australian Financial Services Licence (AFSL). ATO statistics, ASFA benchmarks, and Age Pension rules change. Seek advice from a licensed financial adviser when personal recommendations are required, and verify current figures with the ATO, ASFA, Services Australia, and ASIC MoneySmart.