Important Disclaimer: This article is for educational and informational purposes only. It does not constitute financial product advice, personal financial advice, or a recommendation. SuperCalc Pro is not licensed to provide financial advice under Australian law (we do not hold an Australian Financial Services Licence).
Past performance does not guarantee future results. The examples, scenarios, and comparisons provided are hypothetical and for illustration only. Market conditions, regulations, and economic factors change over time. What worked historically may not work in the future.
You should consult a licensed financial adviser (AFSL holder) for advice specific to your personal circumstances, objectives, financial situation, and needs. Always read the Product Disclosure Statement (PDS) and consider your own circumstances before making any financial decisions. Never make financial decisions based solely on information from this article or any calculator tool.
Your super fund's projection looks great. "You'll have $1.2 million at retirement!" it says. "You can spend $60,000 per year!" But here's what they don't tell you: that projection assumes everything goes perfectly. It uses average returns. It doesn't show you what happens if you retire into a crash.
Super fund projections are designed to be optimistic. They want you to feel confident about your future. Confidence without understanding sequence risk, inflation shocks, or a forced early exit is a different kind of danger.
Free calculators, including your super fund's, can't answer these questions. They use averages that hide worst-case scenarios. Historical data shows the truth.
How Super Fund Projections Work
Super funds use a simple formula:
The Super Fund Formula
Starting balance: $250,000
Contributions: $10,000/year (including employer contributions)
Return assumption: 7% per year (average)
Years to retirement: 20 years
Result: $1.2 million at retirement
This looks scientific. It's based on maths. But it assumes consistent returns of exactly 7% every year, which never happens. It assumes no crashes like 2008 in your first years of retirement. It assumes inflation stays at 2.5%, which isn't always true. And it assumes the order of returns doesn't matter, when in fact it does.
The problem is that real markets don't work like this. Some years you get 20% returns. Other years you lose 30%. The order matters, especially in retirement. A crash in your first year of retirement hurts a lot. The same crash in your tenth year is usually manageable. Super fund projections can't show you this because they smooth everything into an average.
What Super Fund Projections Hide
Your super fund's projection doesn't show you the things that actually matter. It doesn't show you sequence of returns risk, where two retirees with identical average returns can have wildly different outcomes based on when they retire. The order of returns matters enormously in retirement: a crash in your first year hurts far more than the same crash in your tenth year. Super fund projections can't show you this because they use averages and assume smooth 7% returns every year. Real markets are volatile, and the order of those returns matters enormously.
They also skip worst-case paths. Super fund projections emphasise the average outcome. Historical series include crashes such as 2008 and inflation shocks such as 1974. A brochure figure near "$60,000 a year" can sit nearer $45,000 a year on those harder sequences.
Many super fund projections use nominal returns, which means they don't account for inflation. They might say "You'll have $1.2M" but not tell you that with 3% inflation, that $1.2M in 20 years buys what $700K buys today. Historical data shows real, inflation-adjusted outcomes. You see what you can actually buy, not just nominal dollar amounts.
Super fund projections also assume a tidy retirement date. Health, redundancy, or a market crash can bring the date forward. Historical testing runs every available start year so you see worst, median, and better paths rather than one optimistic line.
Super fund says $70K/year. Real 1970s data says $45K. Test your retirement against 98 years of real market crashes, not smooth assumptions.
Stress-test with historical data →
The Gap: Super Fund vs Historical Data
| Factor |
Super Fund Projection |
Historical Backtesting |
| Returns |
Fixed return for the period (e.g., 7% every year) |
Real market sequences (volatile) |
| Worst-Case |
Not shown |
Shows actual worst periods |
| Sequence Risk |
Ignored |
Tested against real sequences |
| Inflation |
May use nominal returns |
Real (inflation-adjusted) outcomes |
| Retirement Timing |
Assumes average timing |
Tests every start year |
| Actionable Insight |
"You'll have $1.2M" (optimistic) |
"Worst case = $X/year" (realistic) |
The gap illustrates the difference between methods. Super fund projections use fixed returns and might suggest spending $68,869/year based on 7% fixed returns. But historical data shows that in the worst periods like 2008, the sustainable amount would be lower because actual market sequences include crashes and recoveries. This difference shows why understanding the methodology matters when interpreting results.
Fixed 7% projection vs historical paths
Take a worked case: age 45, $250,000 super, $10,000 a year in contributions, retiring at 65. A smooth 7% every year produces a neat ending balance and a neat spending figure. Markets do not deliver that path.
Super fund style projection (fixed return)
Assumptions: 7% fixed return every year for 20 years
Starting balance: $250,000
Annual contributions: $10,000/year
Result at 65: about $1.38 million
Implied spending at 5%: about $68,900/year
What historical backtesting adds
The same inputs can be run across every retirement start year in the historical series. You then see a range: paths that look close to the brochure number, and paths where early crashes and recoveries cut the sustainable drawdown.
In the illustrative comparison used later in this article, a smooth-average plan that looks like $60,000 a year can sit nearer $45,000 a year on a harsh historical sequence. That is a roughly $15,000 income gap on the same headline assumptions, not a guaranteed personal shortfall.
Use the Advanced Calculator with your own balance, fees, and Age Pension settings for a number that belongs to you. The point of this section is the method gap, not a universal "$300K" headline.
If someone budgets to the fixed-return figure and then retires into a weak sequence, the brochure income is the first thing that breaks. Historical testing shows that risk before you treat the projection as a plan.
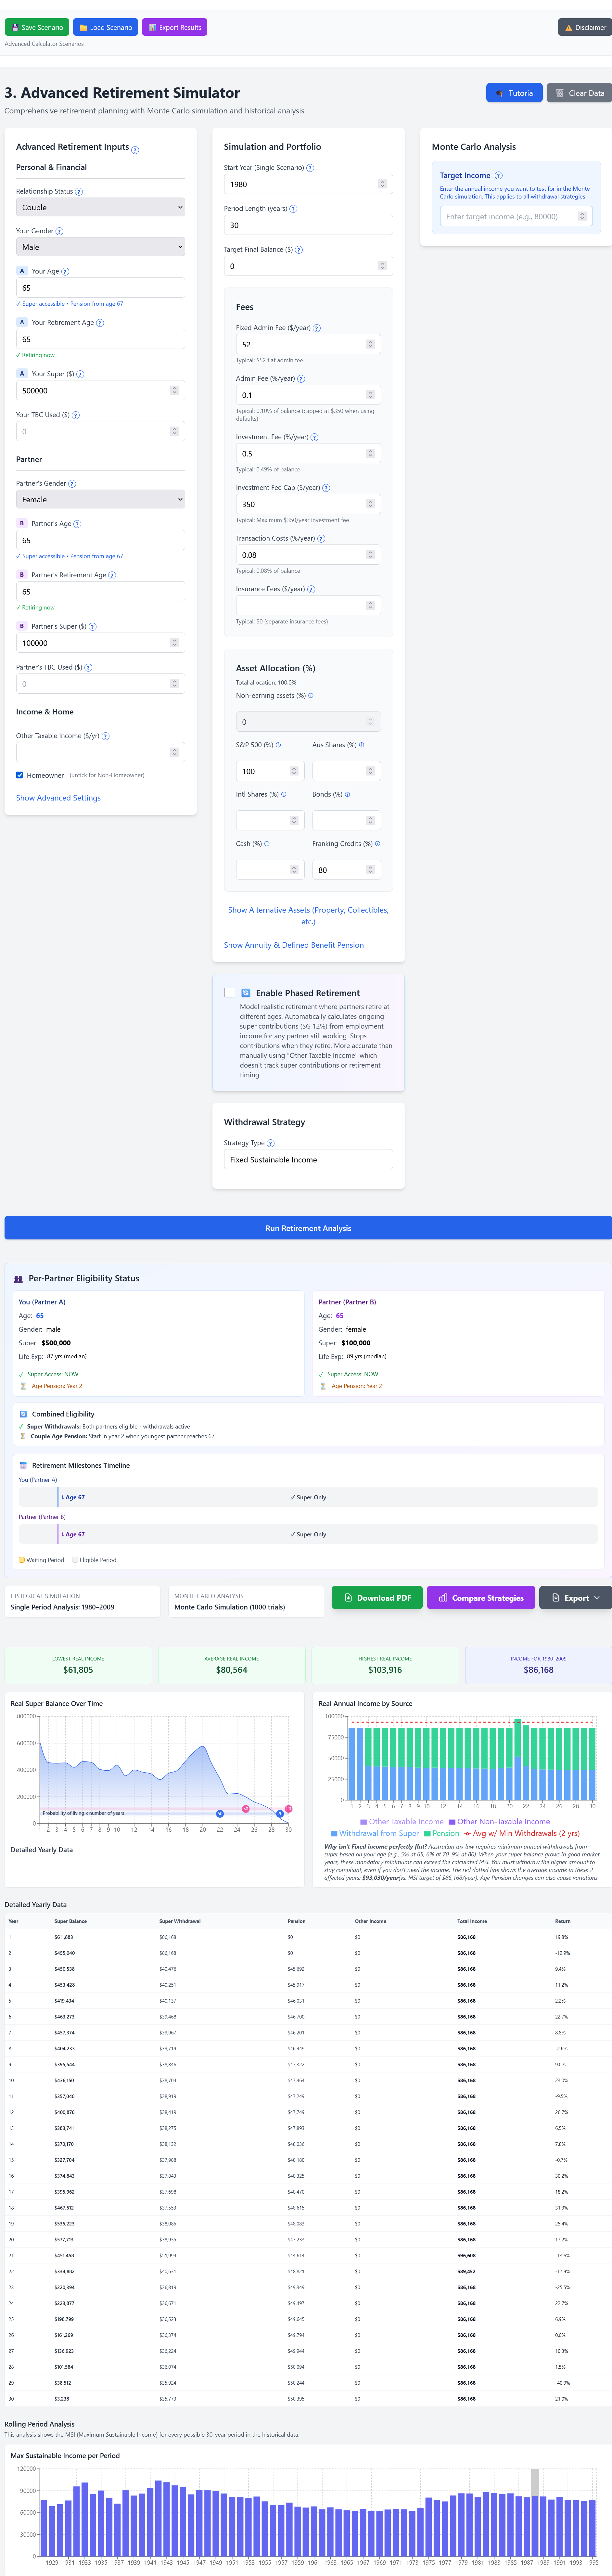
Historical backtesting shows worst-case, average, and best-case outcomes, not just a single projection
The key difference is method. Super fund projections use a fixed return assumption. Historical backtesting shows how the same plan would have performed under actual market sequences. Understanding both stops you from treating a smoothed average as a floor.
See the projection, not just the rule: You enter your balance, target income, and allocation; the app runs Historical Backtesting across every start year. You see the gap between "average return" projections and the worst-case that actually survived. Run the 60-Second Stress-Test to fix your projection with real data.
How to Stress-Test Your Plan
Historical backtesting can show a worst-case safe income: the drawdown that survived harsh periods such as 1929, 1973, or 2008. In a simple illustration, if that floor sits near $45,000 a year, some households plan a little above it so they have room if they retire into a crash. Others stay closer to the floor. That choice is personal.
The same method lets you change the inputs that usually break brochure plans: retiring at 60 instead of 65, contributing less than the assumed $10,000 a year, or earning closer to 5% than 7% over long stretches. Inflation spikes matter too. A nominal "$60,000 a year" twenty years out is not the same purchasing power after a 1970s-style price shock, which is why inflation-adjusted historical paths are more useful than a single nominal projection.
Worst-case $45K vs optimistic $70K? Test your retirement against every market crash, inflation spike, and sequence risk since 1928.
Run historical backtesting →
What Free Calculators Miss
Free retirement calculators, including super fund tools, have the same limitations. They use averages and assume smooth returns every year. They don't show historical worst periods. They ignore the order of returns, so sequence risk never appears in the output. They may use nominal returns without inflation adjustment. And they can't test different scenarios, so you can't stress-test your plan.
The result is that free calculators give you optimistic projections that don't account for worst-case scenarios. They might indicate you're on track when historical data suggests different outcomes. A free calculator might suggest spending $60K/year based on 7% average returns, but historical data shows that in the worst periods like 2008, the sustainable amount might have been $45K/year. That $15K difference illustrates why understanding the methodology matters when interpreting results.
The Value of Historical Stress Testing
Historical backtesting isn't academic window dressing. It can change the spending number you treat as safe, and sometimes the retirement date you aim for.
~$15K
Illustrative income gap ($60K vs $45K paths)
98 yrs
Historical start years available to test
Range
Worst / median / best paths, not one average
How it works: A fixed-return projection might say you reach about $1.38 million on 7% every year. Historical paths for the same contribution schedule can finish lower or higher depending on the sequence. The useful output is the income range that survived, not a single smoothed balance.
That is also why an income brochure figure near $60,000 a year can sit nearer $45,000 a year on a harsh sequence in the illustrative comparison above. Both perspectives belong in the plan.
Bottom line: Historical data shows what actually happened in past market conditions. Super fund projections use averages that hide worst-case scenarios. Understanding both perspectives helps you better interpret the results you see from retirement planning tools.
How to Fix Your Projection
Understanding how to interpret retirement projections can help you make more informed decisions. Historical backtesting tests your exact plan against every historical retirement start year. It shows your worst-case safe income, the amount that survived even the worst periods like 1929, 1973, or 2008. This represents a floor, the absolute minimum that historically survived.
Some people choose not to plan exactly at their worst-case floor, but instead plan 10-20% above it. This provides a buffer if they retire into a crash, while still knowing their absolute minimum. Testing different retirement ages, contribution levels, and return scenarios shows how sensitive a plan is to changes. If small changes cause big problems, the plan might be considered aggressive.
As people get closer to retirement, updating projections regularly can be helpful. Balances change, market conditions change, and needs change. Testing against historical data can help ensure plans remain on track. In a hypothetical example, if historical data shows a worst-case safe income of $45K/year, but someone wants to spend $55K/year, they might consider building a buffer through saving more, working longer, or being prepared to reduce spending if they retire into a crash. However, these are individual decisions that should be made with professional advice.
The Bottom Line
Super fund projections are designed to be optimistic. They use averages that hide worst-case scenarios. They don't show sequence risk, inflation impact, or retirement timing effects.
Historical backtesting provides a different perspective. It tests plans against every historical period. You see worst-case, best-case, and average outcomes. This helps you understand what actually happened in past market conditions, not just what looks good on paper.
Understanding the difference between super fund projections and historical backtesting helps you better interpret the results you see. Both have value, but they answer different questions. Historical data shows what actually happened. Super fund projections show what might happen if everything goes according to average assumptions. Neither guarantees future results, but understanding the methodology helps you make more informed decisions.
Don't Plan on Averages. Test Against Reality.
Run your retirement plan against 98 years of real market data. See your worst-case income, best-case income, and everything in between.
Run the 60-Second Stress-Test
Important Disclaimer: This article is for educational and informational purposes only. It does not constitute financial product advice, personal financial advice, or a recommendation. SuperCalc Pro is not licensed to provide financial advice under Australian law (we do not hold an Australian Financial Services Licence).
Past performance does not guarantee future results. The examples, scenarios, and comparisons provided are hypothetical and for illustration only. Market conditions, regulations, and economic factors change over time. What worked historically may not work in the future.
You should consult a licensed financial adviser (AFSL holder) for advice specific to your personal circumstances, objectives, financial situation, and needs. Always read the Product Disclosure Statement (PDS) and consider your own circumstances before making any financial decisions. Never make financial decisions based solely on information from this article or any calculator tool.
Data Sources: Historical market data 1928–2025, SuperCalc Pro calculator analysis. All calculations and projections are estimates only.
What it costs to keep modelling
Run Advanced Retirement free first. Unlimited scenarios, historical stress tests, and PDF exports are $149 a year, or $14.99 a month if you’d rather not commit upfront, typically less than one hour of paid advice for the same modelling work.
Run the Advanced Calculator →
No card required to try it. Subscribe only if the model is useful enough to keep using.