Most people meet one headline when they first stress-test a retirement plan: a Monte Carlo survival rate. Sixty percent sounds worrying. Eighty percent sounds fine. The brain treats that single number as a verdict on the whole plan.
There is a second percentage that uses the same target income and the same Australian rules. The figures in this article come from the Advanced Calculator engine (Fixed strategy, Age Pension on, default fee and portfolio settings in the batch). Monte Carlo used 500 trials per case. Historical hit rates count every rolling start year that fits the period length.
Lead example: a single retiree aged 65 with $1.5 million in super, 35-year horizon, target income $90,000 a year in today’s dollars. Safe income for a 1980 start under those inputs was about $102,600. Monte Carlo survival against the $90,000 target was 61%. Historical MSI cleared that same $90,000 bar in 44 of 64 rolling periods, 69%.
Keep only the 61% and you understate how often real Australian start years still cleared the spend you care about. The two scores answer different questions; the disagreement is the signal.
What each percentage actually counts
Monte Carlo survival asks: if we reshuffle historical return and inflation years into new sequences, how often can this household still support the target income for the full retirement period without running out under the model? Bad years can cluster in ways history never quite arranged. The success rate is the share of those random paths that still clear the bar. The earlier explainer on Monte Carlo retirement simulation in Australia covers how those paths are built.
Historical periods at or above target asks something else. For every possible start year in the history file, compute the MSI for that start: the highest constant real income that period could have sustained. Count how many of those MSI figures sit at or above the income you asked to test, then divide by the number of periods. In the $1.5 million example, that is 44 of 64 starts at or above $90,000.
One test invents new sequences from the same year library. The other keeps each stretch of history in the order it actually happened. Ordered historical stress tests catch crashes and recoveries as Australians lived them. Random paths catch combinations that never arrived as a single block of calendar years. Read the two percentages together; neither is a personal probability of success.
What the engine batch actually showed
Across several household shapes on the same engine, historical hit rate often sat a little above Monte Carlo when the target was near a comfortable MSI. Both fell together when the target was aggressive.
Single, age 67, $800,000 super, 30-year period, target $55,000: historical hit rate 97% (67 of 69 periods), Monte Carlo 87%. Historical looks stronger; Monte Carlo is the harsher random-path check.
Couple, older partner 60 and younger 58, about $2 million combined, phased exits, target $150,000: historical 83% (53 of 64), Monte Carlo 76%. Same direction, smaller gap.
Couple around $1.15 million combined at age 65, both already retired in the model, target $95,000: historical 42% (27 of 64), Monte Carlo 48%. Monte Carlo sat a few points higher here. Large gaps the other way, with a comfortable Monte Carlo score beside a much thinner historical hit rate, did not appear in this batch.
Age Pension, minimum drawdowns, phased couple exits, and fees sit inside both engines on the same Advanced inputs. You are comparing two stress geometries on one Australian plan, not a toy Monte Carlo against a spreadsheet average.
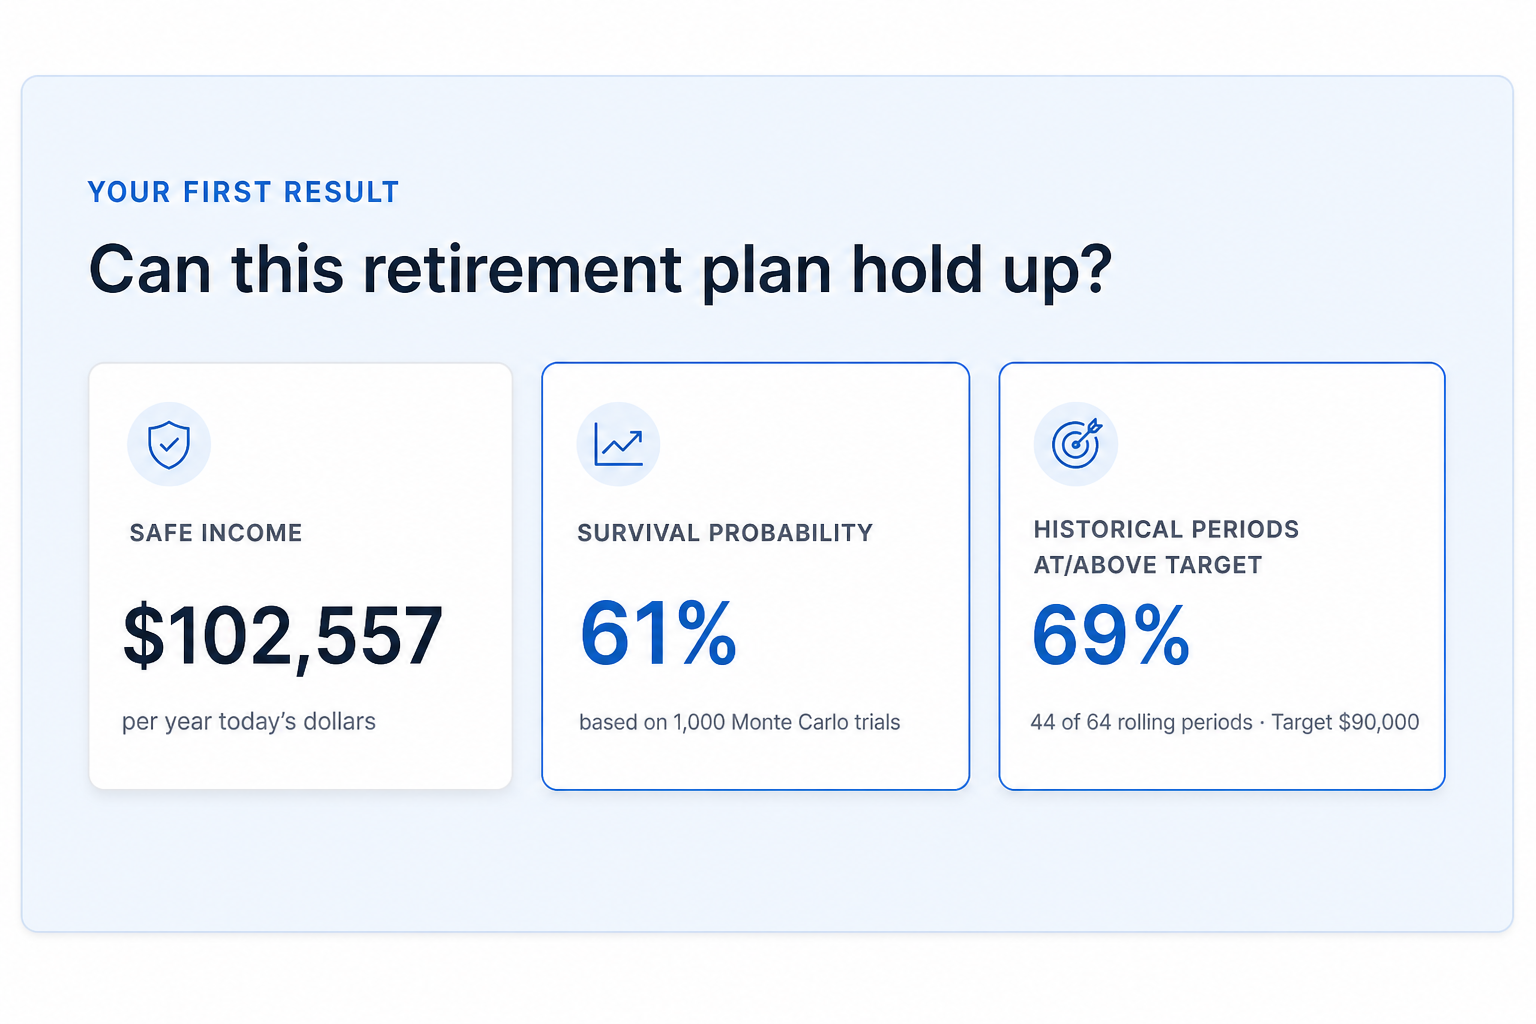
Cards matching the measured $1.5M / $90k case: Monte Carlo about 61%, historical hit rate 69% (44 of 64).
See both numbers on your own inputs
Open Advanced, set Target Income to the spend you actually care about (or leave it blank to use calculated safe income), run the plan, and read Survival Probability next to Historical periods at/above target.
Run the $1.5M example path →Free Advanced runs first, no card required. Set Target Income to $90,000 and compare both percentages on your machine.
How to use the disagreement
If Monte Carlo sits below the historical hit rate, treat the random-path result as a warning about sequences history did not serve as a single block. Ask whether you have cash or outside buffers for early bad years, whether the target is sticky or flexible, and whether a slightly lower spend lifts both numbers into a range you can live with. Keep the historical hit rate in view; it still says how often real start years cleared your bar.
If Monte Carlo sits a little above historical, that is not a green light to ignore ordered crashes. In the engine batch that gap was usually small. Replay the worst historical starts on the chart either way, and check whether Age Pension and drawdown rules are doing the work you assume in those paths.
High scores on both sides mean more evidence of robustness, not certainty. Low scores on both sides usually point at the target rather than the method. When the two percentages split, you have a planning conversation instead of a single pass/fail mark.
What a single-average calculator leaves out
A fund or MoneySmart-style planner that assumes a constant real return never produces either percentage. There is no distribution of random paths and no rolling MSI across start years. You get one smooth income path and a false sense that markets average themselves in calendar order. Australian retirees live through GFC openers, early-1990s inflation, and long bull stretches that do not cancel neatly inside a 35-year window. The dual readout is two ways to fail a spending target, shown side by side, on the same Centrelink and drawdown rules.
Percentages will move if you change allocation, fees, Age Pension settings, or trial count. Treat the batch as evidence of the dual-lens pattern, not as a frozen score for your household. Models also omit health shocks, family transfers, behavioural spending spikes, and policy changes. Licensed advice still matters when the numbers sit near a decision you cannot reverse easily.
Related reading and official context
Keep both lenses on your plan
Try the dual readout free first. When you want unlimited historical and Monte Carlo runs, PDF exports, and saved scenarios, Advanced Retirement is $149 a year, or $14.99 a month if you would rather not commit upfront.
Open Advanced Retirement →No card required to try. Subscribe only if seeing both stress tests on your numbers is worth keeping.
General information only. This article is educational and does not consider your objectives, financial situation, or needs. It does not recommend that you open, close, or change any super fund or product. SuperCalc Pro Pty Ltd does not hold an Australian Financial Services Licence (AFSL). Consider licensed financial advice, and confirm current rules with Services Australia and the ATO, before making retirement decisions. Example percentages in this article are illustrative model outputs, not forecasts of personal outcomes.