Imagine it's September 1929. You've just retired at 65 with what feels like a comfortable nest egg. The economy is booming, the "Roaring Twenties" have lived up to their name. Stocks have tripled in the past decade. Your financial adviser (if such a profession existed then) has calculated that you can safely withdraw a fixed amount of $5,000 per year (which happens to be 5% of your starting balance), adjusted for inflation each year, and this will see you through a comfortable 30-year retirement. You're feeling confident.
Within weeks, your entire retirement plan will be in ruins.
The Unfolding Disaster
On October 24, 1929, less than two months after your hypothetical retirement, panic selling begins on Wall Street. "Black Thursday" sees trading volume so heavy that the ticker tape falls hours behind. The following Tuesday, October 29, becomes "Black Tuesday," with the market dropping 12% in a single day. By mid-November, stocks have fallen 40% from their September peak.
But this is just the beginning. Unlike modern crashes that typically recover within a few years, the Great Depression drags on. By July 1932, nearly three years after the crash began, the market has fallen 89% from its peak. Your $100,000 portfolio, equivalent to roughly $1.8 million in today's money, is now worth $11,000. And you've been withdrawing money to live on the entire time, selling shares at progressively worse prices.
The market stages a partial recovery through the mid-1930s, offering false hope. Then in 1937, another crash wipes out half the gains. It isn't until 1954, twenty-five years after the initial crash, that the market finally returns to its 1929 peak. By then, your 30-year retirement is nearly over, and your portfolio has been ravaged by decades of poor returns combined with ongoing withdrawals.
Running the Numbers
Let's put actual figures to this nightmare scenario. Starting with $100,000 in September 1929, a 60/40 portfolio (60% stocks, 40% bonds), and withdrawing a fixed amount of $5,000 per year (calculated as 5% of the initial balance) adjusted annually for inflation, what happens?
The first year is brutal. Your portfolio drops to roughly $70,000 while you withdraw $5,000. By year three, you're down to about $35,000, but your inflation-adjusted withdrawal has actually decreased slightly due to deflation, one small mercy. By the bottom in 1932, your portfolio has fallen to around $25,000, and you're still withdrawing over $4,000 annually.
Here's the remarkable thing: this portfolio survives. Barely. The combination of bonds providing some stability, deflation reducing withdrawal amounts in the early years, and the eventual (if painfully slow) market recovery allows the portfolio to limp through 30 years. But it's a close-run thing, and the psychological toll on the retiree would have been immense.
A fixed withdrawal amount calculated as 6% of the initial balance ($6,000 per year), however, fails. The portfolio runs out of money around year 22. The difference between withdrawing $5,000 versus $6,000 per year, between survival and failure, is the difference between anxious success and outright ruin.
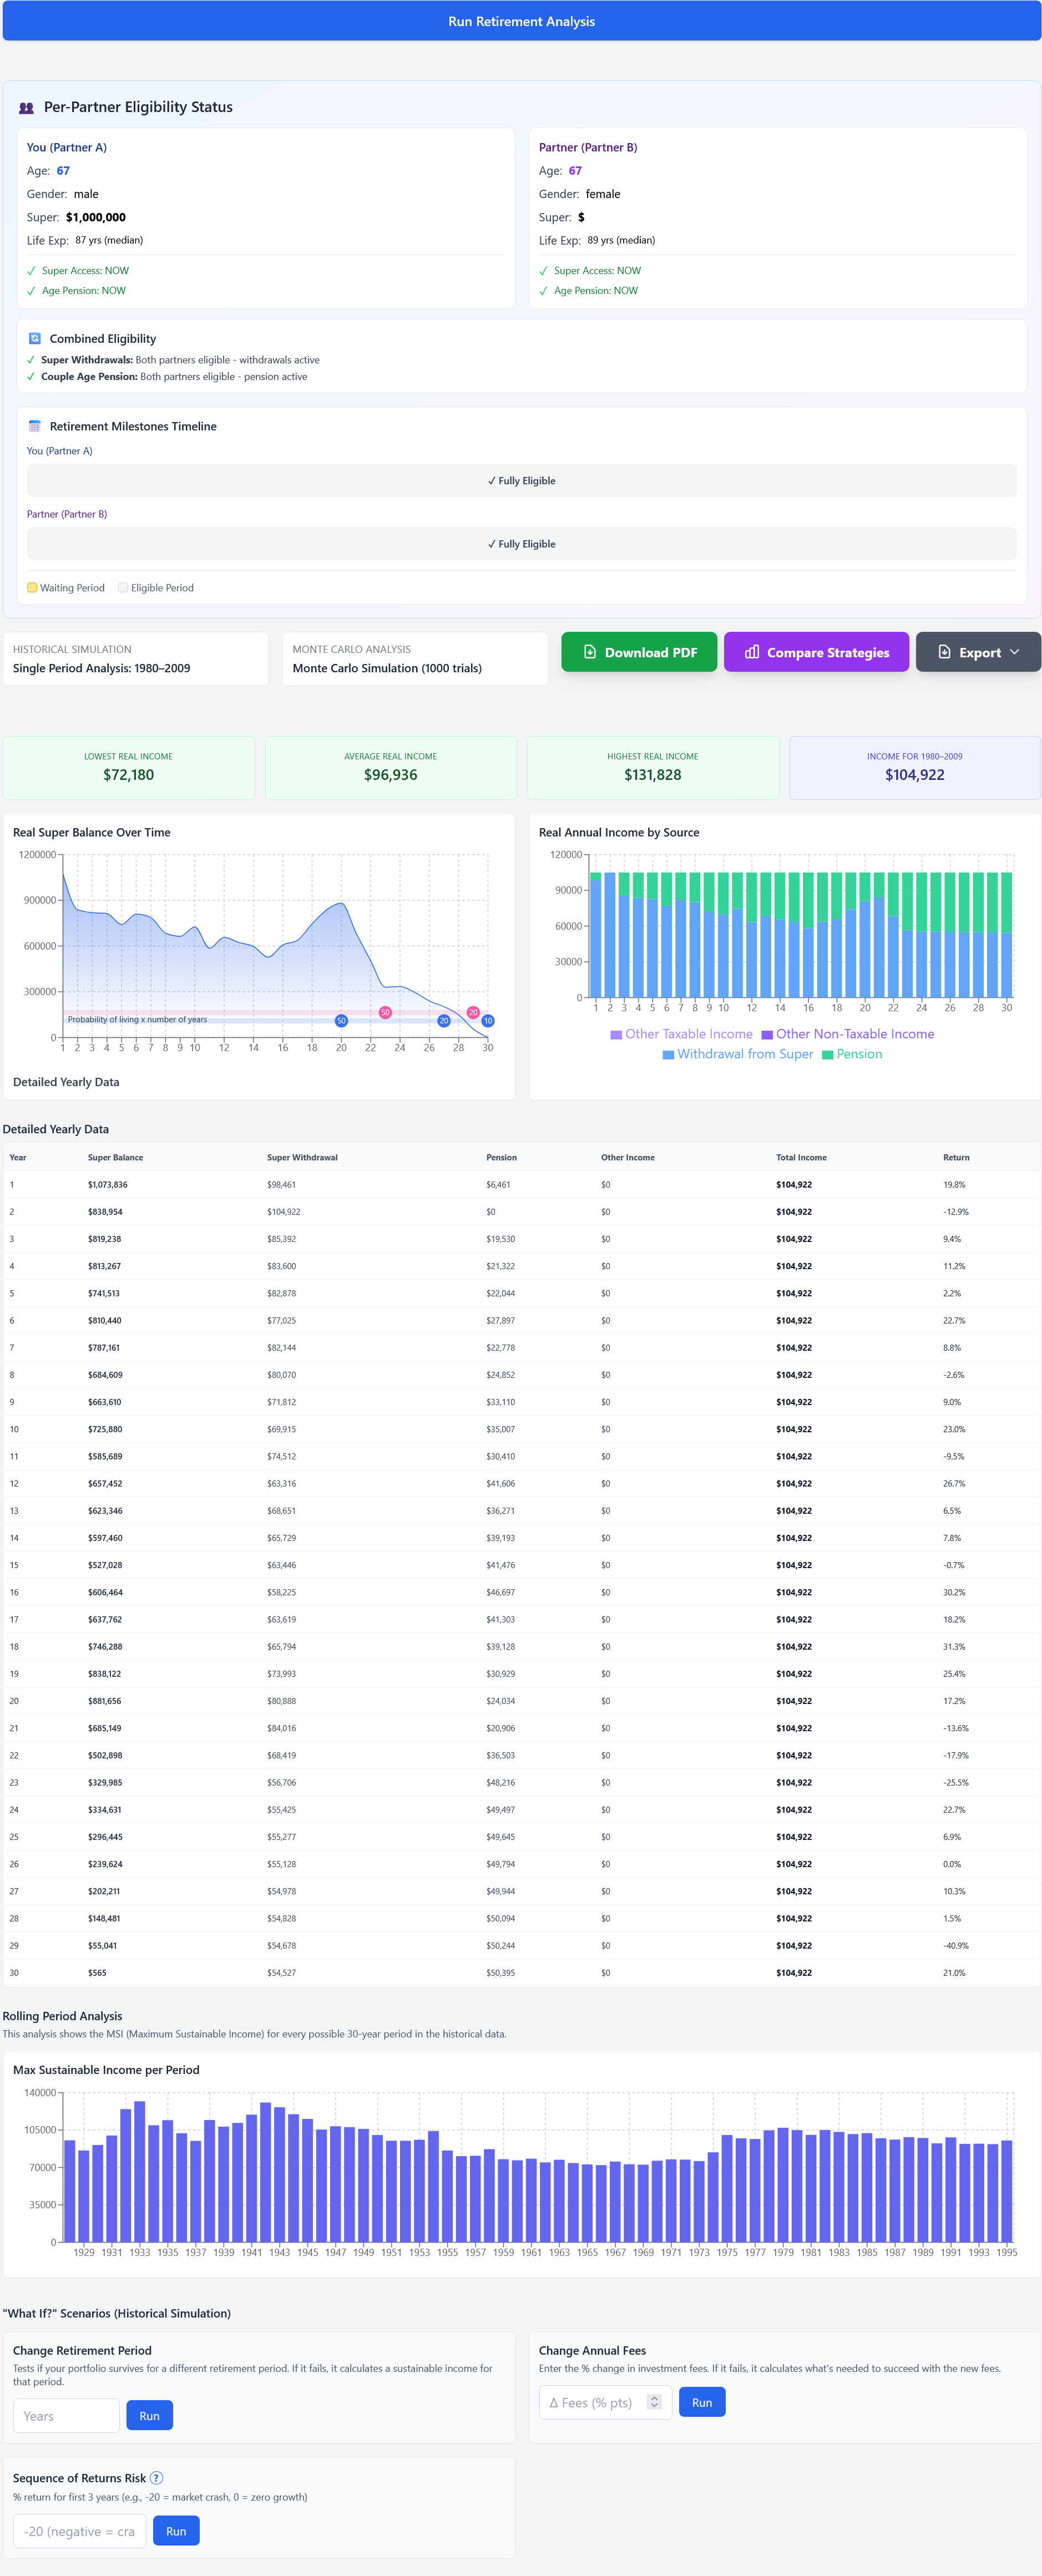
Historical backtest: maximum sustainable income for every retirement start year since 1928, including the 1929 crash.
Why 1929 Was So Devastating
The 1929 retiree faced a perfect storm of negative factors, and understanding them helps explain why this period remains the ultimate stress test for retirement planning.
The most critical factor was timing, what we now call "sequence of returns risk." The worst returns came in the first years of retirement, when withdrawals have maximum impact. A 50% drop in year one of retirement is far more damaging than a 50% drop in year twenty, because early withdrawals permanently reduce the number of shares available to benefit from eventual recovery. The 1929 retiree was selling shares at the worst possible time, locking in losses that could never be recovered.
The duration of poor returns compounded the problem. This wasn't a sharp crash followed by quick recovery, like 1987 or even 2008. It was a decade of misery. The market didn't return to its 1929 level until 1954. For a retiree withdrawing throughout this period, there was no opportunity for the portfolio to recover, it was being drained continuously while returns remained poor.
Deflation in the early 1930s provided some relief, prices fell, so the real value of withdrawals decreased, but this was followed by inflation in later years, requiring larger nominal withdrawals just as the portfolio was depleted. The whipsaw between deflation and inflation made planning nearly impossible.
Finally, there was no runway for recovery. A crash in year fifteen of retirement, while painful, leaves time for markets to recover before the portfolio is exhausted. A crash in year one leaves no such buffer. The 1929 retiree was hit immediately and had to endure the entire downturn while simultaneously drawing down their savings.
Lessons for Today's Retirees
The 1929 scenario offers profound lessons for anyone planning retirement today, even though the specific circumstances are unlikely to repeat exactly.
The first lesson is that the early years of retirement are disproportionately important. The returns you experience in the first five to ten years of retirement have far more impact on your outcome than returns later on. A good start provides a buffer against future downturns; a bad start creates a hole that's almost impossible to climb out of. This argues for being more conservative with withdrawals in early retirement, regardless of what "safe withdrawal rate" studies might suggest.
The second lesson is that fixed sustainable income strategies, withdrawing the same inflation-adjusted dollar amount each year regardless of market conditions, can be dangerous in extreme scenarios. The 1929 retiree who calculated their initial withdrawal amount (say, $5,000 per year, which might have been 5% of their starting balance) and then rigidly withdrew that same inflation-adjusted dollar amount every year, regardless of how markets performed, survived, but barely. A retiree who had the flexibility to reduce withdrawals during the worst years would have emerged in far better shape. Dynamic withdrawal strategies, where you take less when markets are down and more when they're up, provide crucial resilience against sequence risk.
The third lesson is the value of cash buffers. Having two to three years of expenses in cash or near-cash means you don't have to sell shares at the bottom of a crash. The 1929 retiree forced to sell shares in 1932 to fund living expenses was crystallising losses at the worst possible moment. A cash buffer allows you to wait out the storm, drawing on reserves while leaving your equity portfolio intact to recover.
The fourth lesson is to test against the worst, not the average. Monte Carlo simulations that assume random returns will tell you that withdrawing a fixed dollar amount equivalent to 5% of your starting balance has a 95% success rate. But the failures aren't random, they're clustered around scenarios like 1929, where terrible returns come early. If your plan survives 1929, it's genuinely robust. If it only survives "average" conditions, you're gambling that you won't be unlucky.
The Australian context: While this analysis uses US data (Australian market data from 1929 is limited), the lessons apply universally. Australian retirees also faced the Great Depression, and sequence of returns risk operates the same way regardless of which market you're invested in. Early-retirement returns matter enormously in any market, not just Australia.
Could It Happen Again?
The Great Depression was a unique confluence of factors: speculative excess, bank failures, policy mistakes, and global economic collapse. Modern financial systems have safeguards that didn't exist in 1929, deposit insurance, central bank intervention, circuit breakers on exchanges, and better regulatory oversight.
But that doesn't mean severe, prolonged downturns are impossible. Japan's stock market peaked in 1989 and still hasn't recovered its highs more than three decades later. Someone who retired in Japan in 1989 with a portfolio of Japanese stocks has experienced something remarkably similar to the 1929 American retiree, decades of poor returns that no amount of time could overcome.
The 2000s gave US investors a taste of this. Someone retiring in 2000 faced the dot-com crash, a partial recovery, then the 2008 financial crisis. It took until 2013 for the market to sustainably exceed its 2000 peak. That's thirteen years of essentially zero returns, during which retirees were withdrawing continuously.
The lesson isn't that 1929 will repeat exactly, but that severe, prolonged downturns are possible, and retirement plans should be robust enough to survive them.
Testing Your Own Plan
The value of historical backtesting isn't prediction, no one knows what future returns will be. The value is stress testing. If your retirement plan survives 1929, 1966 (another terrible starting year), 2000, and 2008, you can have reasonable confidence it will survive whatever the future brings.
This is why the calculator includes historical backtesting against every retirement start year from 1928 onwards. You can see exactly what would have happened to your specific plan, your balance, your withdrawal rate, your asset allocation, if you'd retired at history's worst moments. If the plan survives, you know it's robust. If it fails, you know you need to adjust before reality delivers the same verdict.
Run your own numbers
Use SuperCalc Pro to test your retirement plan with Australian super, Age Pension rules, and historical market stress tests.
Open Advanced Retirement Calculator