What is a phased retirement calculator for couples?
It models different retirement ages, wages while one partner still works, when each person can access their own super, and when Age Pension kicks in year by year as one household. In SuperCalc Pro that lives in the Advanced Retirement Calculator, with historical stress tests and Monte Carlo survival odds on the same inputs.
What the calculator does: separate retirement ages and balances for each partner, keep salary and employer SG on until each person actually stops, apply Australian Age Pension and minimum drawdowns as the household phases change, then find maximum sustainable income on historical paths (and run Monte Carlo on those same inputs).
Why it matters: forcing one exit date skips the years when one wage is still holding the plan up. In a bad start year like 1973, that missing wage can be the difference between a spend that survives and one that does not, even when the starting balances look the same.
Important: General information only, not financial product advice. SuperCalc Pro does not hold an Australian Financial Services Licence (AFSL). This article does not recommend opening, closing, or changing any super fund or product. Seek advice from a licensed financial adviser where you need it.
Most free couple tools assume both partners retire together, draw from one combined balance, and hit Age Pension as a single event. Some adviser or fund tools do let you set different retirement ages, but still lean on a handful of return scenarios, or run two individual streams without finding a household maximum sustainable income on the same historical paths. Plenty of households do not retire in lockstep. One person reaches preservation age and wants out; the other still has a mortgage to finish or a job they are not ready to leave. If you are already in that stretch (one retired, one still working), a napkin projection with one exit date can look fine while the year-by-year cash flow is wrong.
Centrelink assesses you as a couple, but super access and wages do not share one calendar. You need each phase run through to full retirement, not a higher average return stuffed into a single exit date.
Run the pre-filled phased couple
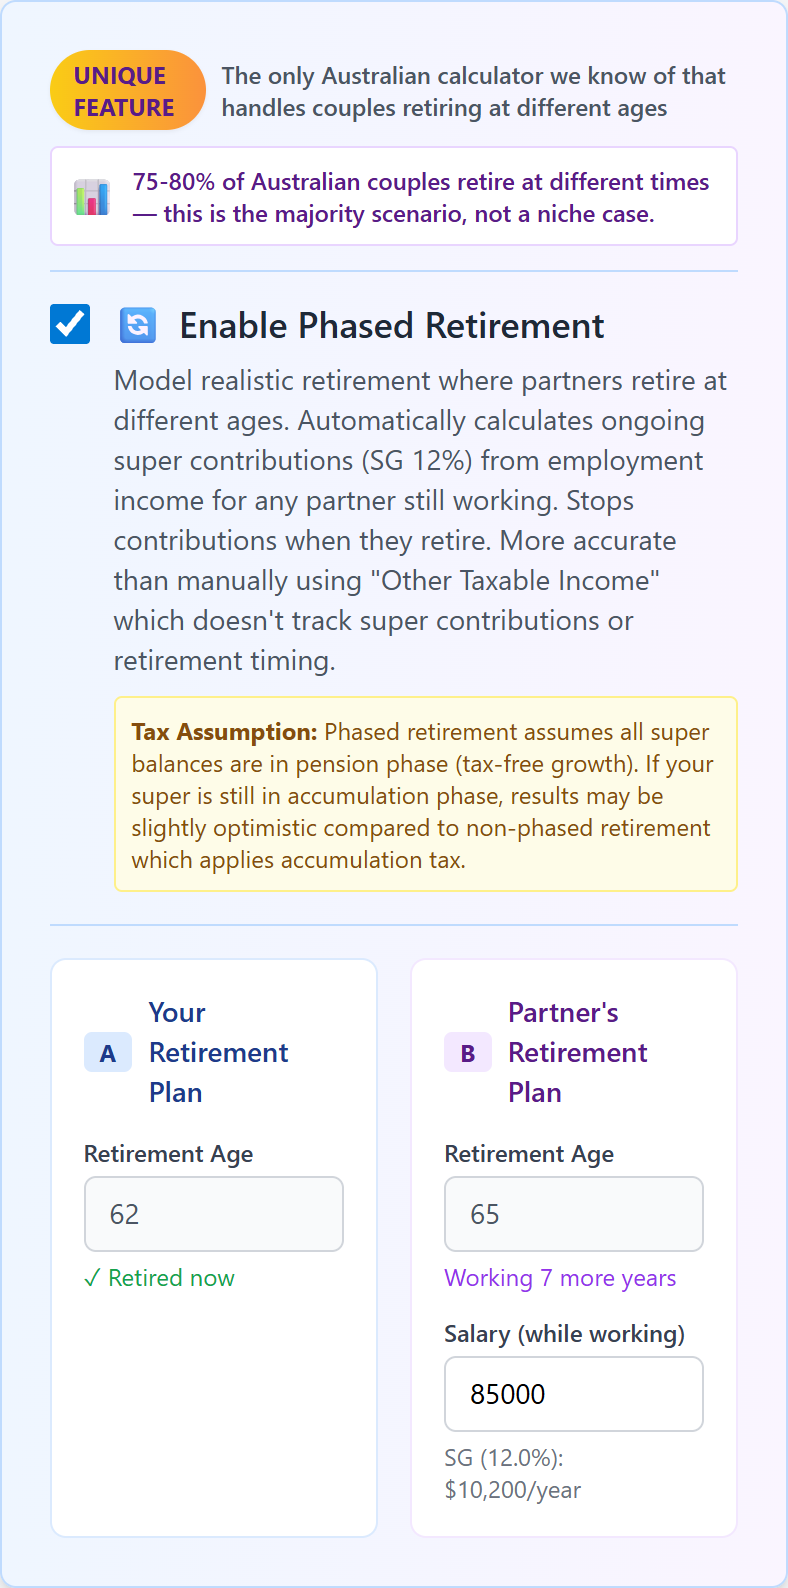
Read the free Advanced calculator landing first if you want the SERP-style overview. Older partner retires at 62; younger keeps working to 65 on $85k wages. Combined supers load into one household model with Age Pension rules across phases.
Run Couples Phased Retirement →Free Advanced runs first, no card required.
Why one retirement date fails
A typical free calculator asks for one age and one combined super balance. That is the wrong shape for most couples. Preservation age is 60 for people born from 1 July 1964, but partners rarely cross that line in the same year. The older partner may be drawing while the younger balance is still locked and still receiving employer contributions. Minimum drawdowns apply per account, not to the household as a whole.
Age Pension adds another calendar. Eligibility is generally 67, and Centrelink tests the couple as a unit. When one partner is still working, that wage can cut or delay pension support even if the retired partner is already on super. Deeming keeps running in the background whether or not anyone is still employed.
Sequence risk bites harder here than the headline balance suggests. If the first partner retires into a weak market and starts drawing while the working partner's contributions are modest next to that drawdown, capital can shrink in the years that matter most. A plan that survives on a smooth 7% average can fail when the first five retired years are ugly, the same sequence problem as any retirement, amplified by who draws first.
The phases worth modelling
Income rarely jumps from "both working" to "both on the pension." In practice you move through something like:
- Both working, employer SG still landing.
- One retired, one working: wages, tax, drawdowns, and any part-pension tests all interact.
- Both retired but under Age Pension age, living mainly on super.
- One on Age Pension while the other is still working or under pension age.
- Both at pension age, with super topping up whatever the means tests allow.
Skip a transition in the model and you are guessing which years actually carry the plan. That mixed Age Pension state is common enough that we wrote a separate piece on the younger partner and Age Pension.
What a bad start year looks like (1973)
Here is the built-in Advanced Calculator couple scenario, Partner A 62 with $520,000 retiring now; Partner B 58 with $310,000, earning $85,000, retiring at 65; homeowners; $70,000 other assessable assets; Age Pension on; 34-year horizon; allocation 25% S&P 500, 35% Australian shares, 20% international, 15% bonds, 5% cash, engine-default fees, run two ways on the same return paths.
Start in 1973, one of the harder windows in the series. If both partners are forced to retire at 62 with no wages after that date, maximum sustainable income (real, today's dollars, including modelled Age Pension where eligible) falls to $61,156 a year. With phased retirement, A out at 62, B working to 65 with salary and SG, MSI holds at $89,606. By year five of that path the phased household still has B's wage plus a modest super draw (~$21,700), while the flat model is pulling the full $61,156 from super alone and the combined balance has dropped to about $240,000.
That is the differentiator in concrete form: same balances, same fees, same Age Pension rules. The only change is whether the model keeps a wage and SG on during the stagger. A single retirement date cannot show you that year-five cash-flow gap.
Across the full historical set (same inputs)
Stepping every start year from 1928 through 1992 (65 windows that fit a 34-year plan), the flat both-at-62 model has a median MSI of $84,682. The phased model median is $105,898: about $21,200 higher on those medians (~25%). Looking at the uplift year by year (phased ÷ flat for each start), the median ratio is about 25.6%, and most of those ratios sit roughly between 20% and 35%.
Those figures come from SuperCalc Pro's own engine on the inputs above. They are a worked example, not an external benchmark, and they are not a forecast for your household. Change salary, exit ages, fees, or turn pension off and the gap can shrink or reverse. A working partner's income can tighten the pension taper, and an early retiree can still draw too hard in a bad market.
Method notes. Maximum sustainable income is found by binary search on fixed real spending, on the same historical return paths, with Australian Age Pension, deeming, minimum drawdowns, and phased SG as implemented in the engine.
Each calendar year carries its own returns for US equities, Australian shares, international shares, bonds, and cash (plus Australian CPI). The portfolio return for a year is the allocation-weighted mix of those series, not a single equity index scaled to look multi-asset, with franking credits applied to the Australian share sleeve where configured.
The 65 start years are overlapping windows on one continuous return history: adjacent starts share most of their path, so they are not 65 independent observations. Treat the 20-35% band as a picture of how the uplift moved across historical sequences in this example, not as a statistical confidence interval.
Whose super first?
There is no single correct order. Drawing the older partner's balance first uses the account that is already open. Leaving the younger balance invested can mean more compounding before it has to feed income. Spouse contributions or contribution splitting can change later Age Pension outcomes, because Centrelink looks at the household, not whose name is on the account.
A transition-to-retirement pension can help the still-working partner in some cases. Whether it is worth using depends on age, tax, and whether you actually need the cash. Whose super to draw is a year-by-year call tied to access rules, not a one-off choice you set at 60 and forget.
History and Monte Carlo together
Phased retirement moves when the first drawdown starts; it does not remove market risk. Historical replay shows how the plan would have fared in real return sequences, including bad decades. Monte Carlo shows how sensitive the plan is if future volatility looks different. The Advanced Calculator landing page covers how those two lenses differ.
When they disagree, that is useful: maybe the working partner's wage is carrying more of the plan than you thought, or the first retiree is drawing too hard relative to ongoing SG. A single median MSI line is one output from the model, not the whole story.
How to run it
Run the Advanced Calculator. Couple mode. Enter each partner's age, super, and intended retirement age. Turn phased retirement on so wages and SG continue until each person stops. Add homeowner status, spending target, and the fees you actually pay.
Run history first. Check sustainable income, worst start year, and the year-by-year income-by-source table. You want wages dropping out on the right dates, pensions starting when preservation allows, and Age Pension appearing when the rules say it should. Then run Monte Carlo against your spending goal.
Change one knob at a time: delay A's exit by two years, cut spending 10%, try B part-time instead of full-time. The value of a phased model is that those knobs exist and you can see what each one does.
Official sources
Preservation age, pension age, and Centrelink means tests change. Check current rules before you act:
ATO: when you can access your super
Load the couple phased example
Same 1973 window as above: flat both-at-62 pulls the full ~$61k from super by year five; phased still has B’s wage. Built-in scenario (62/58, $520k/$310k, B works to 65 on $85k). Swap in your ages and balances, then replay the ugly start years, not only the median.
Open Advanced Retirement CalculatorBottom line
Phased retirement is a sequencing problem: preservation age, wages, drawdowns, and Age Pension eligibility move at different speeds. A calculator with one retirement date cannot tell you whether A can stop at 62 while B works to 65 without running out of runway in year four of a bad market.
Run the phases. Stress-test the years when only one income source is doing the work. The uplift in the example is for those stated inputs. Rerun with your own ages, balances, and wages before treating it as a forecast.
What it costs to keep modelling
Run the pre-filled couple scenario free first. When you want unlimited household runs, historical stress tests, and PDF exports, Advanced Retirement is $149 a year, or $14.99 a month if you’d rather not commit upfront, typically less than one hour of paid advice for the same Centrelink interaction work.
Run Couples Phased Retirement →No card required to try the scenario. Subscribe only if the household model is useful enough to keep using.
Disclaimer: This article is general information only. It is not financial product advice or personal advice. SuperCalc Pro Pty Ltd does not hold an Australian Financial Services Licence (AFSL). We do not recommend that you open, close, or change any super fund or product. Simulation results depend on inputs and methodology. Past data does not predict future performance. Government rules and rates change. For advice tailored to your situation, see the ATO, Services Australia, or a licensed financial adviser.