Limited Recourse Borrowing Arrangements (LRBAs) allow SMSFs to borrow to buy property or other assets. The pitch is compelling: use leverage to buy a bigger property, amplify returns, build wealth faster. But leverage cuts both ways. It amplifies losses as much as gains, and inside super the risks are especially dangerous.
LRBAs are complex, expensive, and create concentration risk that can wreck retirement plans. Interest costs are substantial, loan terms are restrictive, and if property values fall or rental income drops, loan repayments can consume your entire super balance. Many trustees who used LRBAs would be better off today if they had simply invested their balance in a diversified portfolio.
This isn't theoretical. ATO data shows SMSFs with LRBAs have higher costs, lower diversification, and often worse outcomes than funds without borrowing. The property spruikers who promote LRBAs don't mention the risks, costs, or alternatives. Here's what they're not telling you.
How LRBAs Actually Work
An LRBA is a loan where the lender's recourse is limited to the specific asset bought. If you default, the lender can take the property but cannot pursue your other SMSF assets. That sounds protective, but it means lenders charge higher interest and require larger deposits to compensate for risk.
LRBAs can only be used to buy a "single acquirable asset": usually a property, sometimes shares or managed funds. The loan must be structured through a bare trust, adding complexity and cost. You can't use borrowed funds to improve the property (beyond basic repairs), and you can't use other SMSF assets as security.
Loan-to-value ratios are typically 70% to 80%, so you need at least 20% to 30% of the property value in cash. On a $1 million property, that's $200,000 to $300,000 of super tied up as deposit. That's money that could otherwise be in a diversified portfolio. LRBA interest rates are usually 1% to 2% above standard variable rates. On a $700,000 loan at 7%, that's $49,000 a year in interest.
The Real Cost of Leverage
Run the numbers on a typical LRBA. You have $400,000 in your SMSF. You borrow $600,000 to buy a $1 million property. Rent is $40,000 a year (4% yield); interest is $42,000 a year (7% on $600,000).
After management (8%), rates, insurance, and maintenance (say 1.5% of value), net rental income might be about $15,300. You're paying $42,000 in interest, so you're losing $26,700 a year. That shortfall has to come from your $400,000 balance. That's a 6.7% drain each year.
If the property grows at 5% a year, it's worth $1.05 million after one year. But you've lost $26,700 from cash, so total SMSF value is $1,023,300. That's a gain of $23,300, or 2.3% on your $1 million. That's below a term deposit, with far more risk. At 3% property growth you're barely ahead; if values are flat or fall, you're losing money every year while the loan balance doesn't shrink.
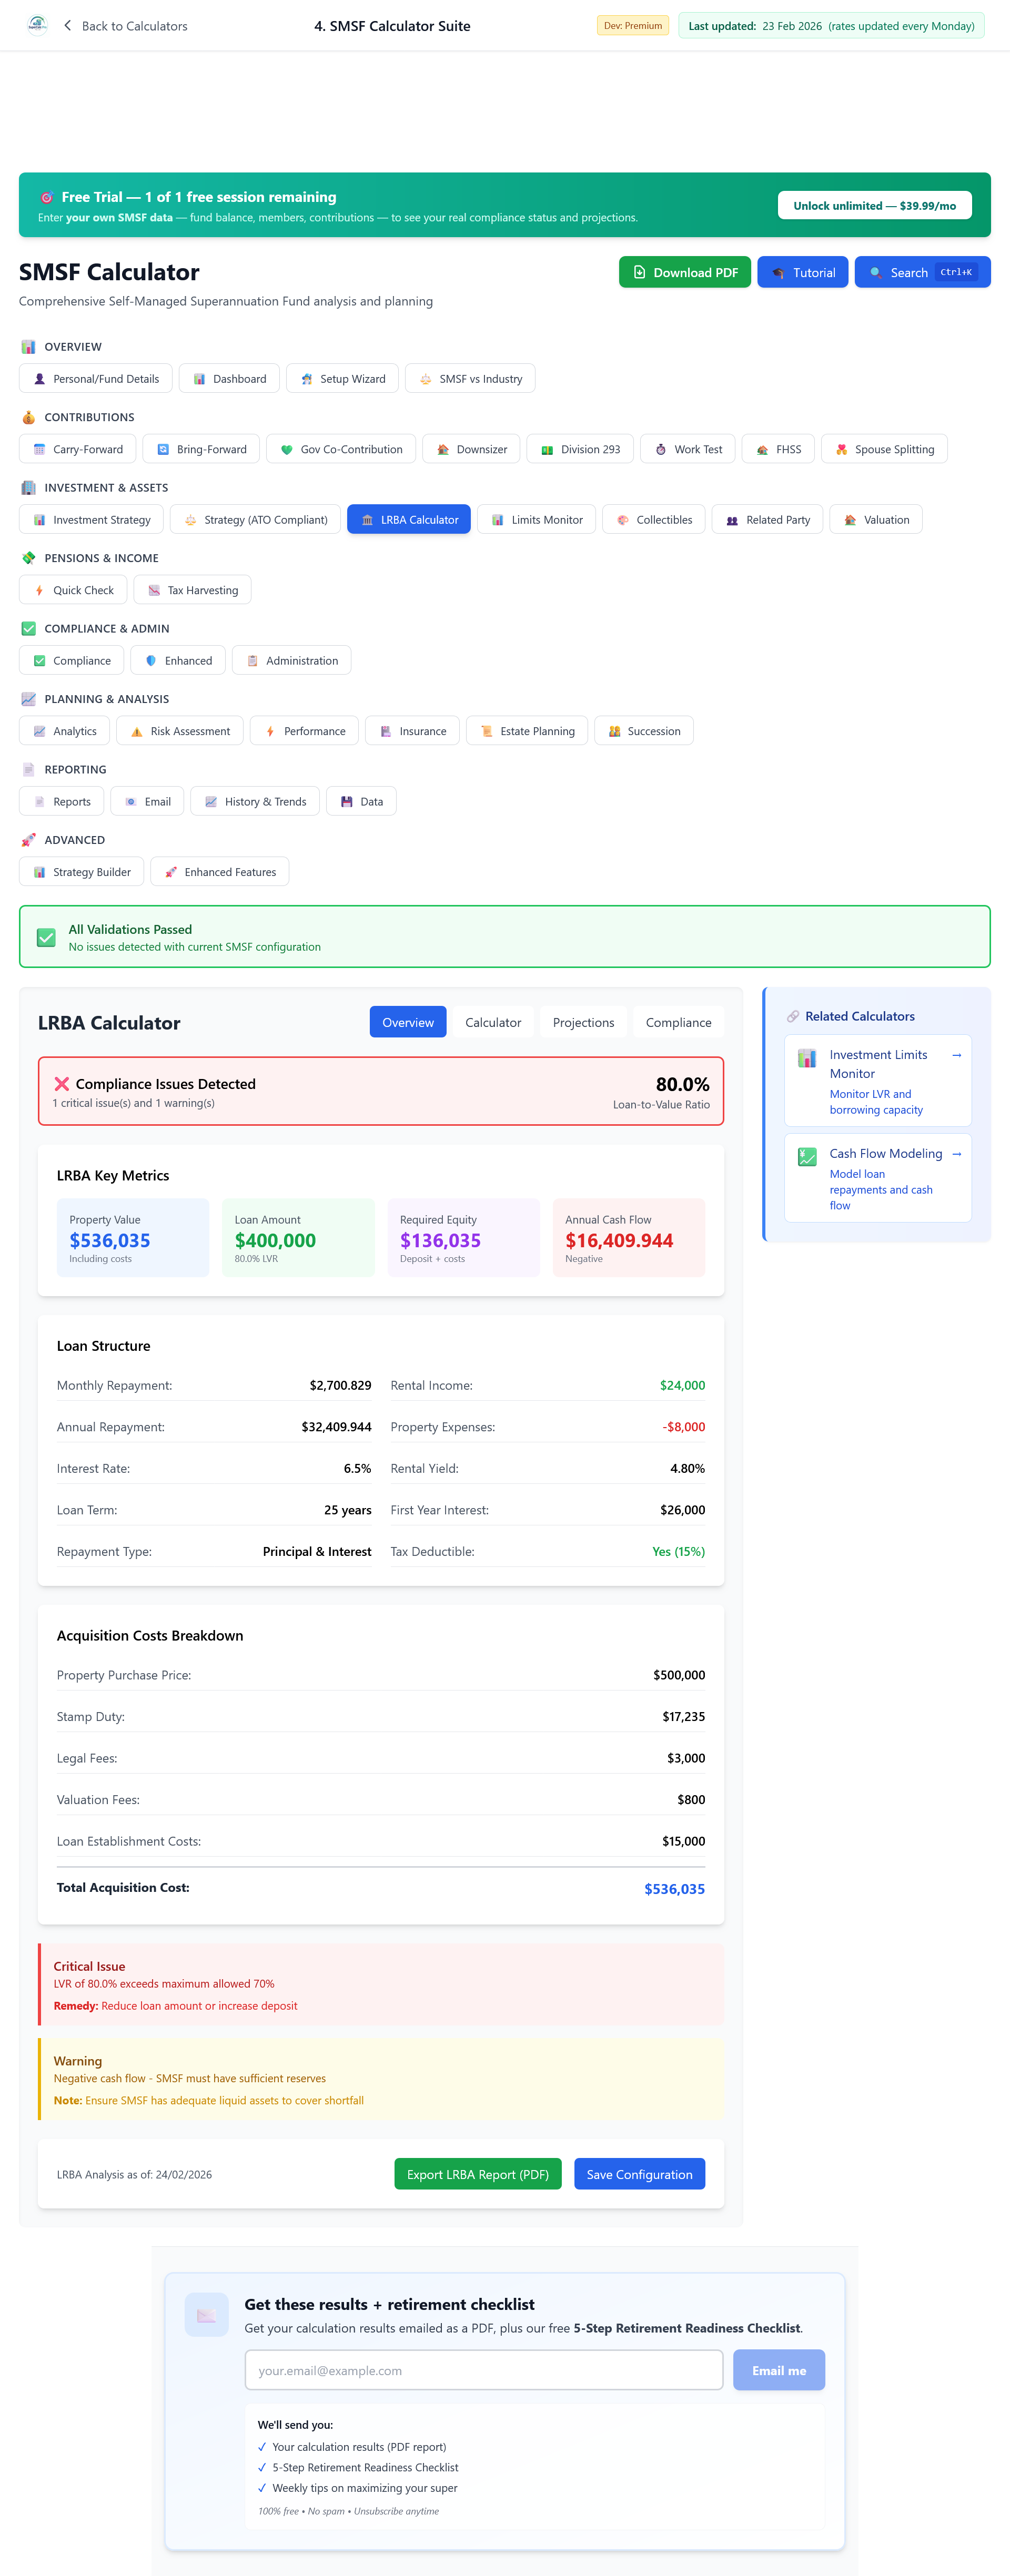
That's why it helps to run your own scenario with real inputs: property value, loan size, interest rate, rent, and expenses. A proper LRBA calculator gives you an overview in one screen: annual cash flow (whether you're in the red or the black), loan-to-value ratio, and whether you're still within the borrowing rules. You see immediately if the deal is funding a shortfall from your balance every year, instead of relying on back-of-envelope sums.
The Concentration Risk Problem
LRBAs create extreme concentration. In the example above, your whole SMSF ($1 million) is in one property. If that property falls in value, becomes hard to rent, or the rental market weakens, your entire retirement plan is at risk.
Compare that to investing $400,000 in a diversified portfolio: hundreds of companies, multiple countries and sectors. One failure has limited impact. With one LRBA property, one failure can be catastrophic. Illiquidity is also dangerous: you can't sell "a bit" of the property. You must sell the whole thing, pay off the loan, and find a buyer. In a weak market that can take months or years while you keep paying interest.
What Happens When Things Go Wrong
Property markets are cyclical. If you buy at the peak with an LRBA and values fall, you can end up in negative equity. The loan exceeds the property value. In a normal home loan that's bad but not necessarily fatal; you can wait or sell and take a loss. In an SMSF LRBA, your retirement savings are on the line.
If rent falls (vacancy, weaker market, or damage), you may not cover interest. You fund the shortfall from super, depleting it further. If the balance runs out, you may be forced to sell at a loss and end up with less super than you started with. Rate rises add to the pain: variable LRBA rates mean a move from 7% to 9% on $600,000 is an extra $12,000 a year from your super.
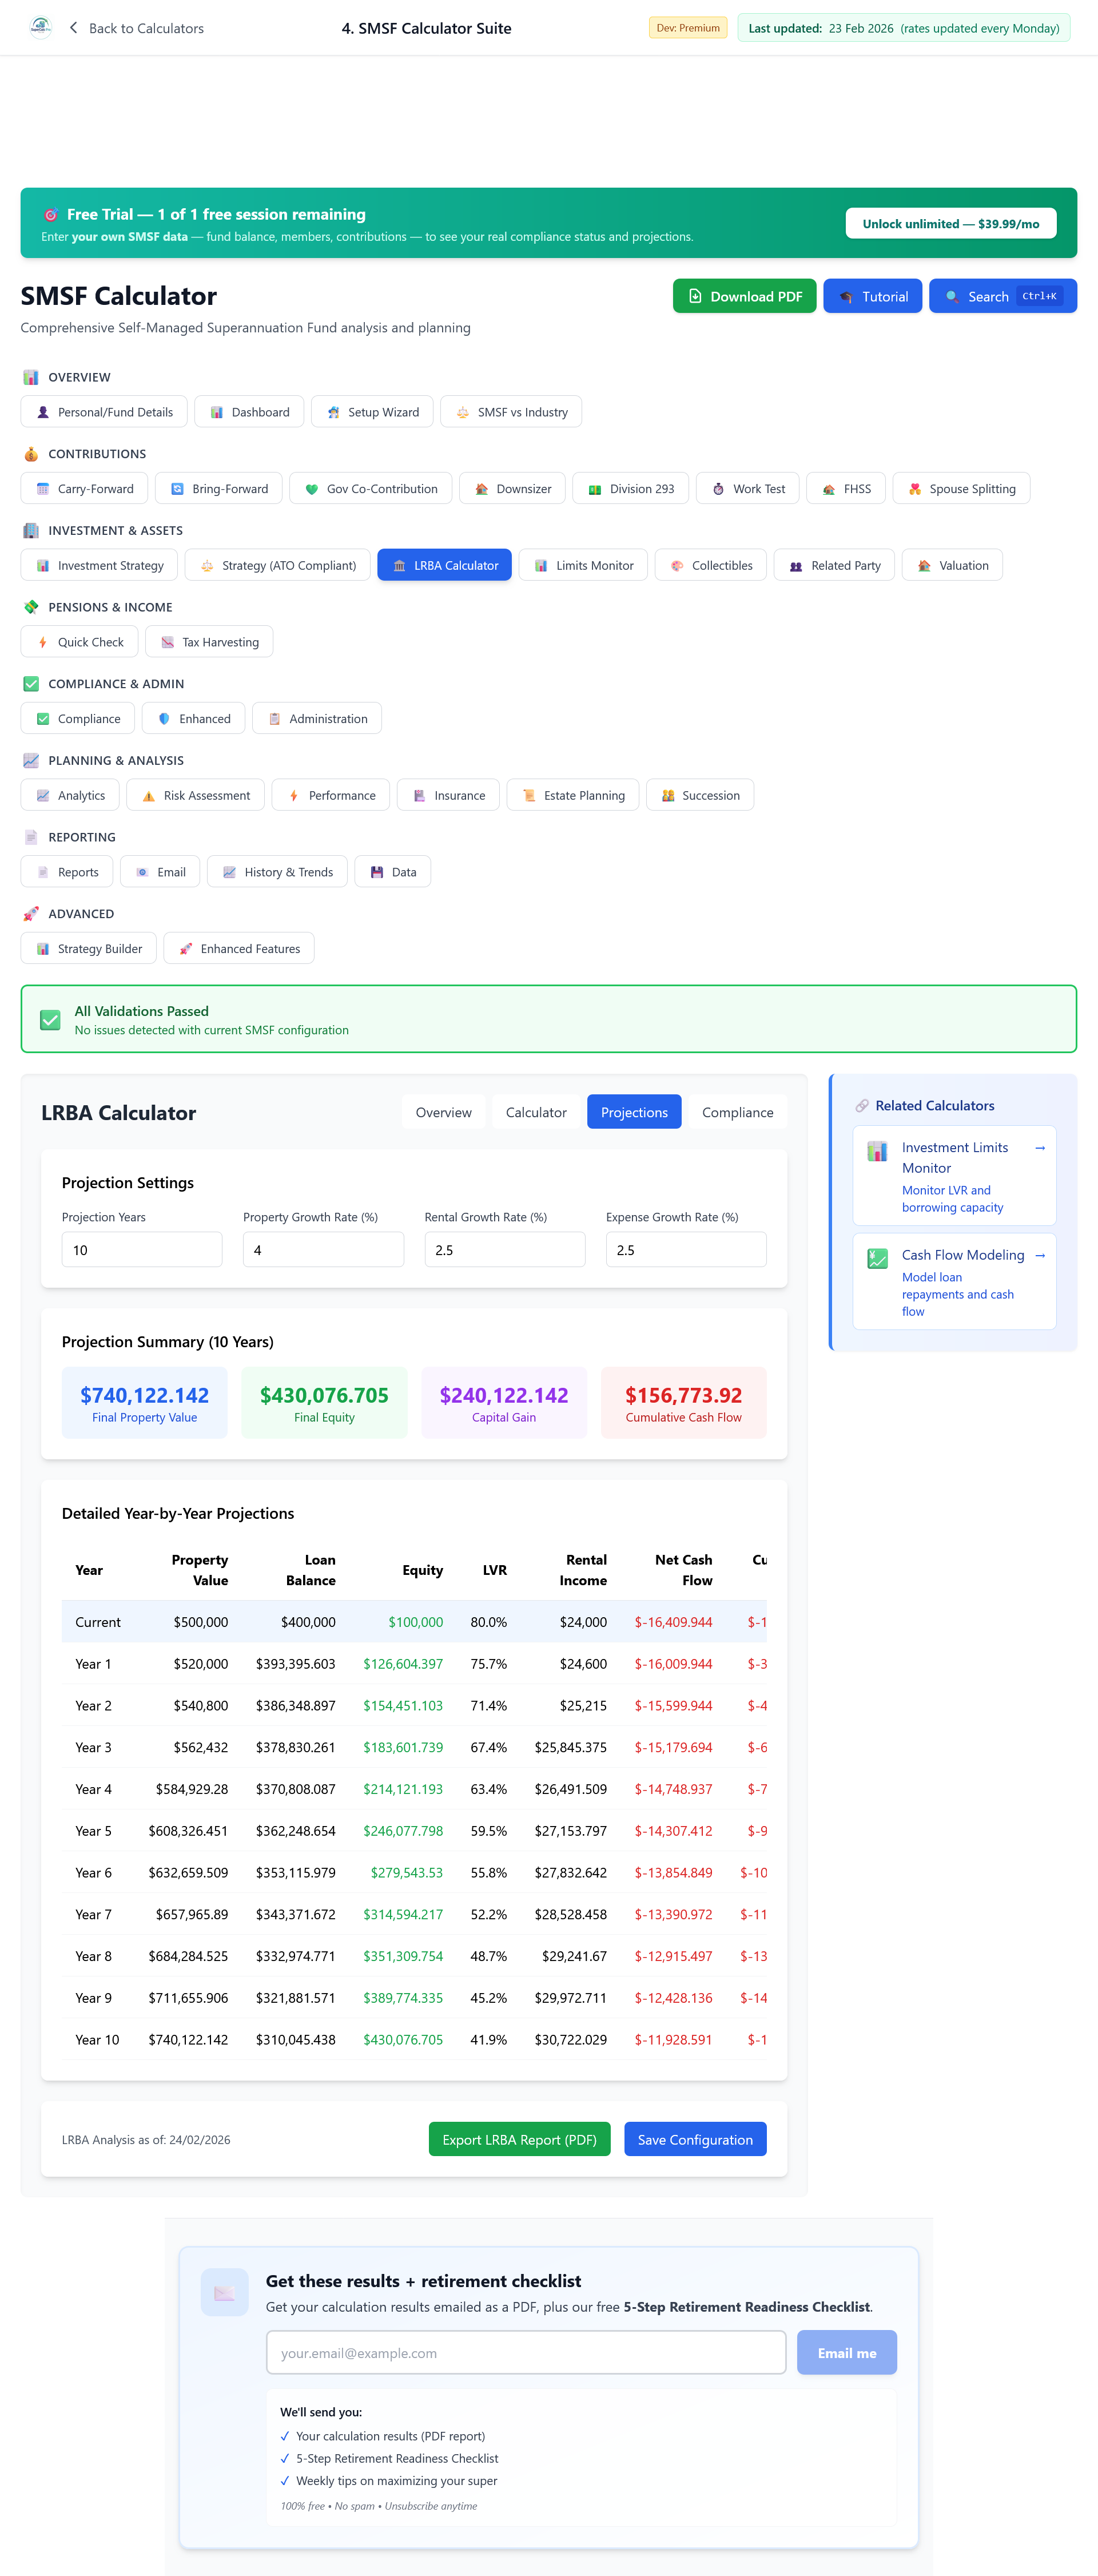
The real value of modelling is seeing the downside over time. A projections view, year by year for a decade, shows how negative cash flow compounds: how much of your balance gets used to plug the shortfall, and where you stand if growth is weak or rates rise. That way you're not relying on a single year's snapshot; you see whether the structure can survive a bad run before you commit.
The Opportunity Cost
Even when an LRBA property does okay, consider the opportunity cost. That $400,000 deposit could sit in a diversified portfolio at 7% a year. After 10 years that's about $786,000. The LRBA property might be worth $1.1 million with $600,000 debt, so $500,000 equity. But you've also been funding negative cash flow from your balance. Historical analysis shows leveraged SMSF property rarely beats an unleveraged diversified portfolio over the long run. Higher costs, concentration risk, and illiquidity usually outweigh the benefits of leverage.
When LRBAs Might Work
LRBAs can work in very specific conditions: a property with high yield (6% or more) that covers interest with margin; buying well below value; a long horizon (15 to 20 years); real property expertise; and the LRBA as part of a diversified strategy, not your whole SMSF. For most trustees those conditions aren't met. The properties pushed for LRBAs often have low yields (3 to 4%) that don't cover interest, are sold at market price, and represent the entire fund. That's dangerous concentration.
⚠️ The bottom line: LRBAs are complex, expensive, and risky. For most SMSF trustees they reduce retirement outcomes. Before considering an LRBA, run the numbers properly, understand all costs, and consider the alternatives. Your retirement is too important to gamble on leveraged property.
Is your LRBA draining your super balance?
The typical LRBA costs $26,700 a year in negative cash flow, funded from your super balance. Enter your actual loan amount, interest rate, rent, and property value in the SMSF Suite's LRBA calculator and see your real annual shortfall, LVR, and how the balance holds up over 10 years. Know before you commit.
Model My LRBA, Open the SMSF SuiteDisclaimer: This article is general information only and does not constitute financial, tax or legal advice. SuperCalc Pro Pty Ltd does not hold an AFSL. LRBAs are complex and carry significant risks. Consult a licensed financial adviser and SMSF specialist before considering an LRBA.