Important: General information only, not financial product advice. SuperCalc Pro does not hold an Australian Financial Services Licence.
The phrase “probability retirement fails Australia” sounds like a single statistic waiting on Google. In practice, failure means different things to different models: running super to zero before a horizon, missing a spending target, or falling below a legacy goal. This article uses one transparent definition matching SuperCalc Pro’s historical sustainability test: fixed annual spending from super (with Age Pension reducing the draw where the engine applies it) over a 28-year horizon from age 67, across every valid historical start year from 1928 to 1997 (70 paths). Failure = a path where the model could not sustain that spend to the end.
Critical caveat: A historical failure rate is not your personal probability of ruin next decade. It is how often the past contained a nasty enough sequence for this strategy under these assumptions. It is still useful precisely because it is grounded in ordered real returns, fees, and actual pension entitlements rather than a smooth average. It does not replace the future, but it is honest about what the past looked like.
Failure rates with Age Pension modelled (single homeowner)
Scenario: $500,000 super, age 67, balanced portfolio preset and fee stack using the Advanced Calculator. Pension is calculated year by year for a single homeowner. Fixed annual spending does not escalate in this test (constant nominal target each year). The baseline is a 28-year horizon to age 95, a conservative longevity assumption that approximately matches ASFA benchmarks for a single female retiree.
| Fixed annual spend | Historical failure rate (70 paths) | Failed paths (of 70) |
|---|---|---|
| $45,000 | 0% | 0 |
| $50,000 | 11% | 8 |
| $55,000 | 24% | 17 |
| $60,000 | 61% | 43 |
| $65,000 | 81% | 57 |
| $70,000 | 93% | 65 |
The step from $50,000 to $55,000 is instructive. Failure rises from about one path in nine to about one path in four. That is the kind of cliff sequence risk creates. Small spending changes interact nonlinearly with bad ordering. See sequence of returns risk Australia for intuition.
Failure rates if super must fund everything (pension off)
The same spend targets, but with pension excluded from the sustainability test, isolate portfolio fragility. This is closer to the offshore withdrawal studies most people have read:
| Fixed annual spend | Historical failure rate |
|---|---|
| $20,000 (4% of $500k) | 9% |
| $25,000 | 14% |
| $30,000 | 29% |
| $35,000 | 60% |
| $40,000 | 79% |
Notice how 4% ($20,000) still shows about 9% historical failure in this stripped-down test. There is no magic zero. Fees, allocation, horizon, and the definition of success all move the needle.
Worst paths: when failure is about the calendar
Beyond pass/fail counts, the engine identifies how much income each historical window could have supported at most. For $500,000 at 67 (pension on), the worst single start year in the dataset was 1969, with maximum sustainable income about $45,826. The best was 1932 at about $80,526. If your fixed spend sits above the worst-case maximum, you are explicitly betting that the future will not rhyme with the harshest paths we can observe. Maybe a reasonable bet, but it should be a conscious one.
What drives failure: sequence risk in three scenarios
A generic failure rate hides the mechanics. Three paths for $55,000 fixed annual spend (76% historical success rate, meaning 24% failure) show how different the story looks depending on when you retired:
Scenario 1: The 1968-1974 retirement (worst-case sequence)
Retire in mid-1968 with $500,000 at balanced allocation. By mid-1974, you face three brutal consecutive drawdowns: equity markets fall ~40%, your balance shrinks to ~$350,000, and you still need to withdraw $55,000 that year. Now you are selling equities at low prices just to meet spending. Age Pension eligibility helps. By year 2-3 your reduced balance means higher entitlements. But pension taper is slow. By year 8, the balance is critically depleted, and even if markets recover after 1974, you've locked in losses on a shrunken pool. This path fails. Spending had to drop to ~$46k to survive.
Scenario 2: The 1982 retirement (mild sequence)
Retire with $500,000 at the start of a 19-year bull market (1982–2000, with minor pullbacks). Markets grow at near long-term average; your balance stays healthy or grows. At $55,000 spending, the pension tapers as super compounds, but super compounds fast enough to offset the fixed withdrawal and inflation (which erodes real purchasing power of the $55k nominal target). This path succeeds easily. Maximum sustainable income in this window was well above $70,000.
Scenario 3: The 1937-1938 retirement (delayed pain)
Retire in 1937, just as markets recover from the Great Depression but hit the sharp 1937–1938 recession. The first decade is sideways-to-negative real returns; your $55,000 withdrawal seems manageable in the early years as the balance erodes slowly. But by age 80–85, compounding losses have caught up. The balance is depleted faster than you anticipated, and you cross the line where even with Age Pension, spending cannot be sustained to 95. This path also fails. The lesson: a smooth average return over 28 years can still fail retirees if bad returns bunch in the early or middle years.
These three stories illustrate why 11% failure at $50,000 is not just a statistic. It is a concrete risk that real cohorts faced. The exact count depends on when you retire, but the type of failure (early crash, late depletion, or grinding sideways years) is always embedded in the historical record.
How small spending changes cascade to failure
The jump from $50,000 (11% failure) to $55,000 (24% failure) is worth unpacking. That $5,000 is a 10% increase in spending, yet failure rate more than doubles. Why?
- Nonlinear sequence interaction: Paths that narrowly survived at $50k (maybe with 2-3 years left in the balance at age 94) tip into failure when the annual draw rises. There are more marginal paths than you might expect.
- Pension taper asymmetry: Your pension entitlements increase as super depletes, but the taper happens only if super is actually depleted. Higher withdrawals speed that depletion, changing when and how much extra pension enters the calculation.
- Volatility amplification: In the worst-case sequences (crashes early), higher withdrawals mean forced selling at lower prices. The 10% spending increase becomes a 15–20% impact on portfolio longevity in bad paths.
This nonlinearity is why stress-testing matters more than point-estimate percentages. Moving from $50k to $55k is not a contained shift from 11% to 24%. It changes which paths survive, and the paths that tip into failure at $55k tend to do so by narrow margins in the worst market conditions.
Monte Carlo “failure probability” vs historical failure rate
Monte Carlo simulation outputs a failure percentage under its random process. That number can agree or disagree with historical counts. If they diverge, you learn about model risk, not which button to trust blindly. Serious planning looks at both and asks why.
Couples vs singles: how household structure changes failure risk
The examples above use a single homeowner because the Age Pension calculation is clearer in isolation. Most retirees are couples, and the failure profile shifts when you account for that:
- Combined income test: Two people's super and income are pooled for pension eligibility. A couple with $500k total super sees different pension entitlements than a single with $500k. Usually lower, because combined assets and income trigger asset tests faster.
- Longevity risk doubles: Two people mean a 28-year horizon is conservative only if both die by 95. If one spouse lives to 100, failure at age 98 is a real event (even if rare). Longer horizons make failure rates worse.
- Survivor volatility: If one spouse dies before the other, the remaining person's super and pension situation changes mid-retirement. Sometimes favourably (lower combined income test), sometimes not (lonelier and possibly more expensive).
For couples, failure rates at the same household spend typically run 3–5 percentage points higher than singles, holding other variables constant. This is not a universal rule. It depends on ages, spousal super balance, and whether one person is under Age Pension age (which changes pension calculation entirely). The takeaway: if you are a couple, do not interpolate from a single's numbers.
What this means: the asymmetry of failure timing
The three scenarios above all fail at $55,000, but for different reasons, and the lever that would have prevented failure is different in each case. There is no single fix.
- For early-crash scenarios (1968–1974): Flexibility matters most. The ability to cut spending in years 2–8 by even $5,000 would often save the plan. Flexibility is cheaper insurance than changing your asset allocation.
- For delayed-pain scenarios (1937–1945): Working longer is powerful. Two extra years of earnings (or two fewer years of withdrawals) pushes the depletion date past the recovery window. Age Pension also enters the picture earlier if you've depleted super by the time you hit 67.
- For all scenarios: The margin between success and failure is often thin (5% spending changes trigger 10–15% failure rate changes). Realistic fees and asset allocation assumptions matter far more than hoping for above-average returns. Optimism about either silently loads failure probability into your plan.
If you are in the 11 to 24% failure band for your chosen spending level, you do not need exotic solutions. You need to know which type of failure you are vulnerable to, then choose flexibility, time, or entitlements as your hedge. Generic advice to reduce fees misses the point. Your specific failure mode tells you which lever actually works.
Behavioural note: Showing a 11% historical failure for a $50k spend is less comforting than “89% success.” They are the same fact. How you frame it changes how you feel, not the arithmetic.
But there is something important both framings obscure. The 89% success rate assumes zero adjustments to the plan across 28 years. Fixed spending, every year, regardless of what markets do. Real retirees do not behave that way. If markets fall hard in year three, most people cut discretionary spending. If the Age Pension entitlement increases as super depletes, that offsets part of the gap. The 11% failure rate is not a forecast that 11% of retirees will run out of money. It is the fraction of historical paths where the rigid fixed-spending rule, with no flexibility at all, broke down. In practice, what “failure” looks like is that at some point the plan needs to be adjusted. Spending comes down a little. A holiday is deferred. The plan adapts. That is not a catastrophe. It is retirement planning working as it should.
See failure and success on your inputs
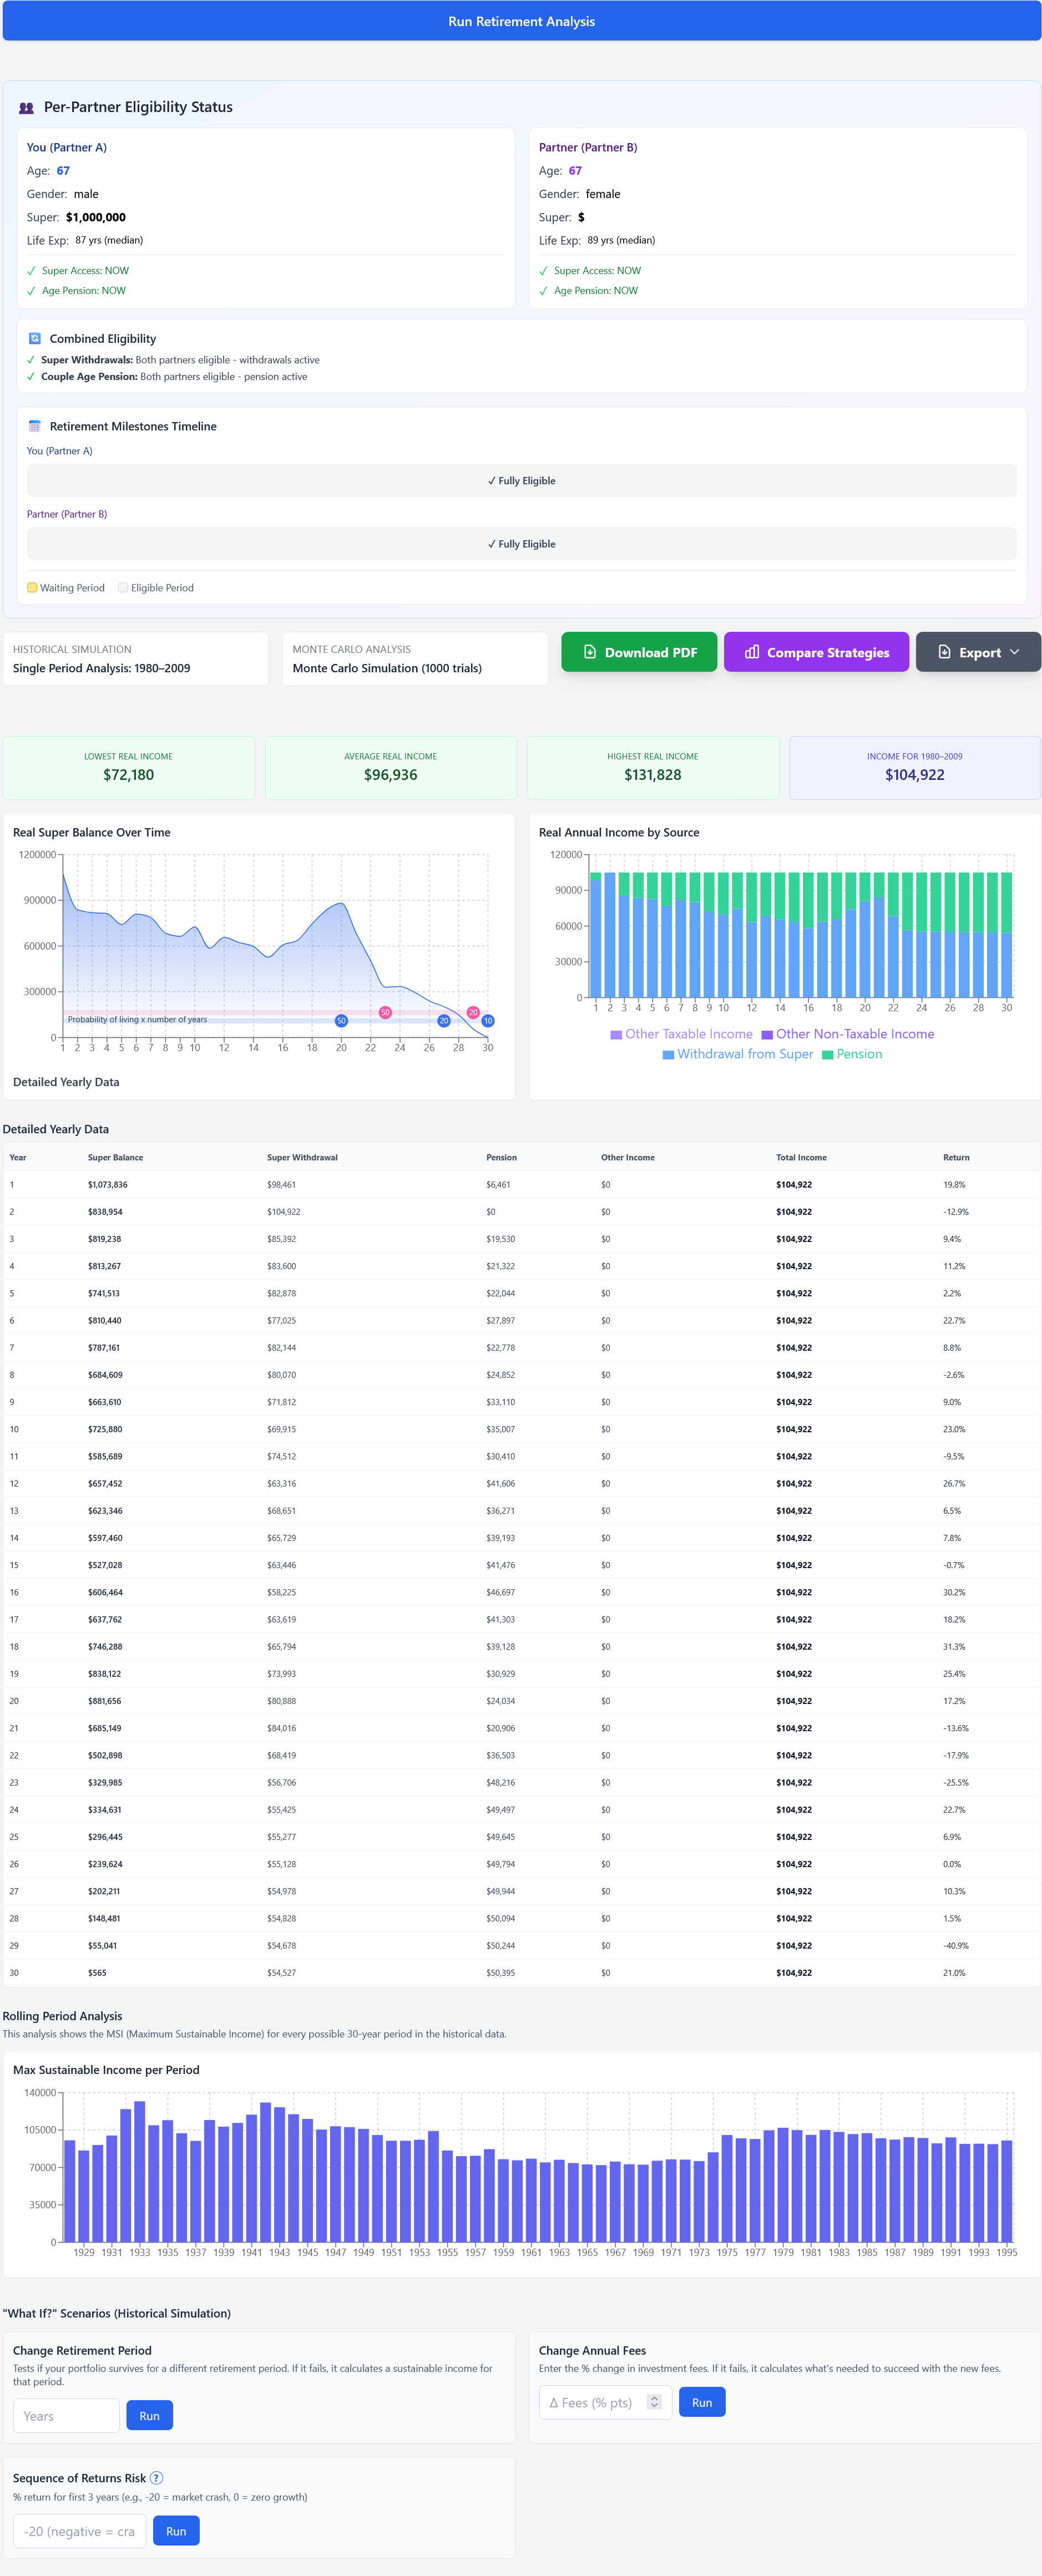
Historical and Monte Carlo views in the Advanced Calculator translate these ideas from a generic $500k example to your balance and pension settings.
Open Advanced CalculatorBottom line
Searching for probability retirement fails Australia should land on assumption-heavy stress tests, not a single national statistic. Under one clear specification, $50,000 fixed spending from $500,000 at 67 failed in about 11% of historical paths with pension modelled, and about 93% failed at $70,000. Name the horizon, the spend rule, the fees, and whether pension is in the model. Then the percentage means something.
Disclaimer: Past performance does not predict future results. Government rules change. Professional advice may be appropriate before altering your retirement strategy.