Important: This article is general information only, not financial product advice. SuperCalc Pro does not hold an Australian Financial Services Licence. Consider your own circumstances and seek advice from a licensed adviser before acting.
Australian retirees in pension phase usually face two different questions that get bundled into one. First: What must I withdraw from my account-based pension this financial year to stay within super law? Second: How much can I safely spend if I want super to last, markets wobble, and maybe the Age Pension tops me up? A coherent super drawdown strategy separates those questions, then connects them with cashflow, tax, and longevity. This article uses the same historical sustainability engine as our other cornerstone posts to show what fixed annual spending survived past paths. Not what your fund brochure assumes with a smooth return.
For rule detail on percentages by age, start with minimum drawdown rates by age. For spending rules compared at a conceptual level, our earlier super drawdown strategies piece remains useful; here we emphasise Australian regulatory context plus hard historical success rates.
Definitions: Drawdown = money leaving the pension account (may exceed spending if you reinvest elsewhere). Spending = cash used for living costs. Strategy = how you choose those flows over time given risk, pension eligibility, and tax.
Minimum drawdown: the floor, not the plan
Once you start an account-based pension, the law requires a minimum percentage of the 1 July balance to be paid out each year (temporary reductions have applied in some years. Always check current ATO guidance). For many retirees aged 65–74, the standard rate has been 5% in recent rules. On a $500,000 pension balance, 5% is $25,000 withdrawn. Not necessarily $25,000 spent. Surplus can sit in a bank account or, subject to rules, be reinvested. Treating the minimum as your budget because "the government set it" confuses compliance with adequacy.
What history says about spending levels (not just withdrawals)
We model a single homeowner aged 67 with $500,000 in super, balanced portfolio settings and standard default fees from the Advanced Calculator, Age Pension applied from 67, and a 28-year horizon. For each fixed annual spend target, the table shows how many of 70 historical start years (1928–1997) could sustain it:
| Fixed annual spend | Historical success (of 70 paths) | Comment vs typical 5% minimum on $500k ($25k) |
|---|---|---|
| $25,000 | 100% | Aligned with 5% minimum drawdown dollar amount; model says historically robust at this balance with pension. |
| $40,000 | 100% | Well above minimum; still cleared all tested paths in this specification. |
| $50,000 | 89% (62 paths) | Comfortable median-style spend for many households; about 11% of paths fail. |
| $60,000 | 39% | High pressure on super unless other assets or pension scope change. |
These numbers are not a recommendation to spend exactly $50,000; they illustrate how sharply sustainability drops as withdrawals outpace what history could absorb. Safe withdrawal rate Australia expands the full grid; probability retirement fails flips the same counts into failure rates.
Maximum sustainable income: planning bandwidth
Another way to frame strategy is to ask: Across history, what income could this balance have supported at most? For $500,000 at 67 (pension on), the latest calculator run gives:
- 10th percentile across paths: $49,956 / year
- Median: $59,247 / year
- 90th percentile: $67,965 / year
If your desired spend sits above the 10th percentile envelope, you are implicitly accepting more sequence risk. You need friendlier-than-worst-case ordering. That may be fine if you have flexibility, other assets, or a younger spouse still earning. It should not be fine by accident. See sequence of returns risk Australia.
Strategic patterns (conceptual, not product advice)
Fixed strategy vs Dynamic SWR
Fixed spending is easy to budget and mirrors how many people think about living costs. It is also the assumption behind the historical tables in this article. The downside is rigidity: after a deep drawdown, the same dollar amount represents a larger slice of a shrunken balance. Dynamic SWR adjusts withdrawals to current conditions and still applies minimum drawdown rules. That can improve sustainability in weak periods, but it creates variable spending from year to year.
The screenshots below show the variation more clearly than a single table row. They are two Advanced Calculator runs for the same base scenario (single homeowner, age 67, $500,000 super, 28-year horizon, start year 1968, balanced allocation, Age Pension on, default fees), with different withdrawal rules applied.
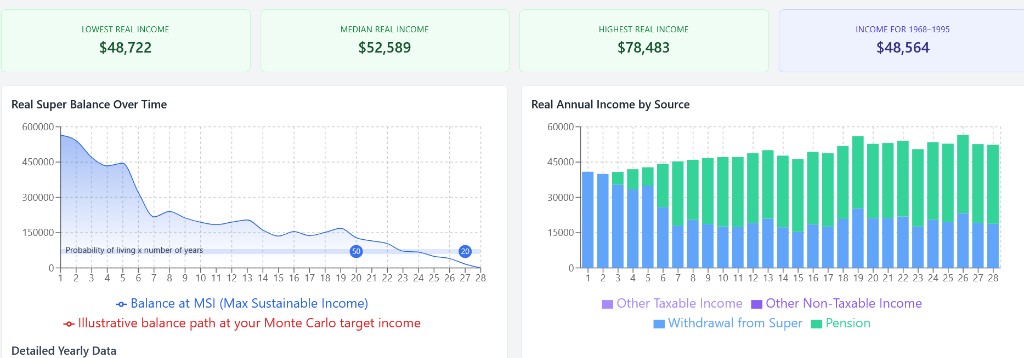
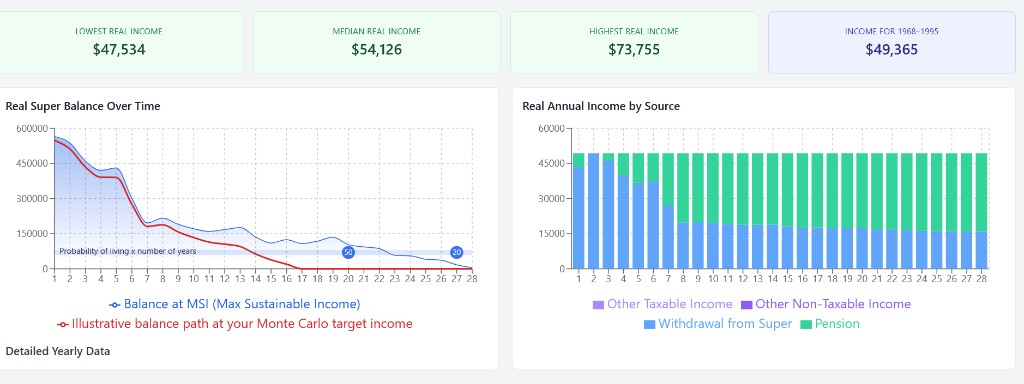
The practical takeaway is visible in the charts themselves: the annual income mix and balance path differ materially between rules, even when the starting balance and market sequence are the same. That is exactly why drawdown strategy choice matters. It changes the shape of income over time, not just a single average number.
What changes when Age Pension is not included
The next two runs remove Age Pension from the model so the portfolio has to carry the full income load. This makes the strategy difference clearer in bad sequences because there is no external buffer absorbing part of the shock.
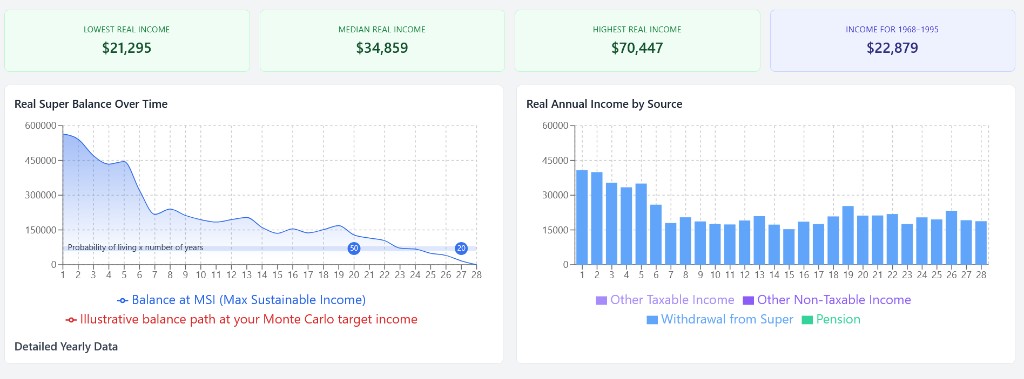
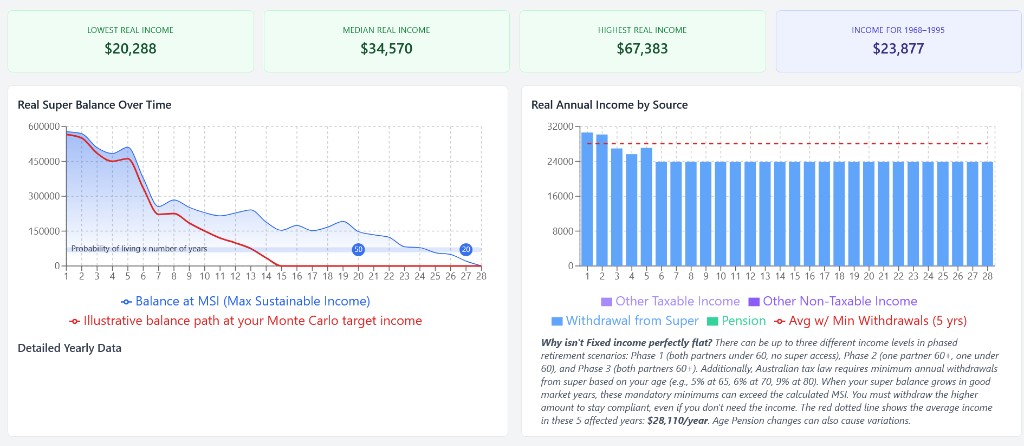
These no-pension runs show two things clearly. First, Age Pension works as a safety net that smooths income when super is under stress. Second, when that safety net is removed and full volatility hits the portfolio, a dynamic rule can be more beneficial because it adapts withdrawals instead of forcing the same draw each year.
Cash buffers and buckets
A common drawdown tactic is to hold 1–3 years of spending in cash or bonds, drawing living costs from that buffer rather than selling equities every month. The logic: after a crash, you're not forced to harvest shares at depressed prices. You wait for recovery, then refill the buffer from equity gains.
How it changes the maths: Our historical engine assumes retirees sell whatever they need to meet spending each year. No separate bucket. That's a conservative test: it forces equity sales even when markets are down. In practice, a cash buffer delays those forced sales by 1–3 years, which can meaningfully improve sequence outcomes. A retiree who survives a 2008-style crash by drawing from cash instead of selling shares at trough prices will have significantly more capital by the time markets recover.
The trade-off: holding cash means holding money outside equities, which reduces long-term compounding. The benefit only realises if a crash happens and you have enough other assets to refill the buffer before it depletes. For households with small super and high spending (like many in our pension-dependent case studies), a buffer may not be affordable. For larger balances, testing the drawdown plan with a modelled buffer (even crude, 2-year cash runway) is worthwhile.
Pairing super with Age Pension
For eligible singles and couples, pension entitlements reduce how much must come from super for a given lifestyle target. Our pension-inclusive tables reflect that for a single homeowner. Couples, assets tests, deeming, and the work bonus all move the result. Another reason not to treat a blog example as your statement of advice.
Lifecycle shifts in drawdown strategy
Most retirees do not follow the same strategy for 28 years. Common lifecycle patterns include:
- Early retirement (65–74): Spending often highest (travel, activities). Minimum drawdown rules apply; may exceed actual spending, creating cash buffering. Age Pension not accessible until 67, so super carries full spending load until then.
- Mid-retirement (75–84): Spending often moderates (less travel, more settled). Minimum drawdown increases. Age Pension eligibility widens; super balance falling helps increase pension entitlements. This is often the stability sweet spot if market sequencing was not brutal early on.
- Late retirement (85+): Spending may fall again (health limits, less socializing) or rise sharply (aged care, health costs). Minimum drawdown continues climbing. Super is often depleted or nearly so; full Age Pension is likely. Aged care assets tests replace super sustainability as the main constraint.
A sensible strategy adapts across these phases rather than robotically following one rule for 28 years. Early-retirement flexibility (ability to reduce spending after a crash) becomes less important if you expect moderate spending by age 80. Late-retirement concern shifts from "will super last to 95?" to "what is my aged care funding?". The percentages in this article are a starting point. Your own strategy should reflect which phase you're in and which risks matter most to you.

Tax, transfer balance cap, and advice boundaries
Drawdown strategy is not only investment science. Tax-free pension phase versus accumulation, transfer balance cap debits, reversionary pensions, and death benefit flows all influence what you should withdraw and when. This article does not cover those rules exhaustively; the ATO and licensed advisers are the right channels for personal structuring.
Bottom line on minimums: Withdraw at least the minimum to comply. Decide spending using needs, buffers, and stress-tested sustainability. The historical engine suggests $500k at 67 with pension has carried $50k spending in 89% of past paths, while $60k only cleared 39% under the same assumptions.
Stress-test your drawdown strategy
Historical backtesting and Monte Carlo in the Advanced Calculator show how different spending rules interact with your balance.
Open Advanced CalculatorClosing
A useful super drawdown strategy Australia connects regulatory minimums, actual spending, other income sources, and honest stress tests. The percentages in this piece are a starting benchmark from one reproducible specification. Your strategy should survive contact with your own balance, partner situation, and professional advice. Not just a single worked example.
Disclaimer: Rules and rates change. Past performance does not guarantee future results. Seek personalised advice where appropriate.