The unread PDF
MoneySmart puts the PDS next to the ATO YourSuper comparison tool when it explains how to compare funds. The glossary says a PDS must cover key features, fees, commissions, benefits, risks, and complaints handling. Fund websites and application packs usually point you there as well.
I have sat through enough thick briefings, in science and in Parliament, to recognise disclosure that is written to a statutory template, not to a busy household’s question list. Super PDS content is largely prescribed. Issuers do not get to invent a friendlier document. The Cooper Review recommended MySuper because so many members never engage with their fund. The government adopted the idea, and Parliament legislated the default later. Plenty of people still land in that default. Disclosure still assumes an informed reader. Behaviour often does not match the assumption.
None of that is a reason to skip the PDS when you are choosing a product. It is a reason to stop treating “I opened the PDF” as the end of retirement planning.
Shorter, and still incomplete
For most superannuation products, the law no longer expects a phone-book statement. Schedule 10D of the Corporations Regulations is the shorter PDS form for those products. If it is formatted for A4, it must not exceed 8 pages. A5 and DL have their own caps. Material incorporated by reference sits outside that page count.
ASIC Regulatory Guide 168 (Product Disclosure Statements: Disclosure and other obligations, December 2025) is the current issuer guide. Incorporation by reference is allowed if the material is in writing, publicly available, uniquely identifiable, and free on request. At RG 168.65, ASIC lists what cannot be incorporated by reference: key features, key risks, issuer details, dispute resolution, cooling-off, fees and costs with worked examples, cost of product information, adviser remuneration with worked examples, and the Consumer Advisory Warning. (ASIC withdrew Information Sheet 155; that shorter-PDS material now sits in RG 168.)
So the 8-page limit is real, and incomplete by design. Investment and insurance guides can still sit behind the shorter statement. Someone who reads the main PDS and skips every incorporated document has not read the full package. Someone who reads all of it still has a product manual, not a model of their household income with the Age Pension.
Where the PDS earns its keep
Use it for product choice. Fees and costs sit under ASIC Regulatory Guide 97 and Schedule 10 of the Corporations Regulations. Administration, investment, transaction costs, and the worked example on a standard balance are there so products can be compared like for like. Insurance premiums, exclusions, and when cover ends belong in the same pack.
One concrete limit of that fee example is the balance it uses. RG 97’s worked “example of annual fees and costs” for super (and the fund PDSs that follow it) is built around a $50,000 balance. That is useful for comparing products. A percentage fee scales by simple multiplication, so you can rescale it. Flat dollar fees are the part that distorts when your balance is ten times larger.
MoneySmart’s Savannah story on the same choosing a fund page is the accumulation version of that work. She is 30, earns $50,000, has $20,000 in super, and cuts fees from 2.5% to 1%. MoneySmart says her balance at 65 is $336,000 instead of $255,000, an $81,000 difference. That is a good use of a fee table: pick a cheaper product for a given risk level. It is still a balance-at-retirement story, not a sustainable drawdown with Centrelink means tests.
What the document cannot answer
The PDS does not know your other assets, your partner’s age, whether you own the home, or which calendar years hit the portfolio first. Sequence risk is the order of returns. Two products with the same long-run average can leave different incomes once you are drawing down. The Age Pension then moves with the means tests as the balance falls. At the balances below, the asset test is the one that binds early on. None of that appears as a household income line in Schedule 10D.
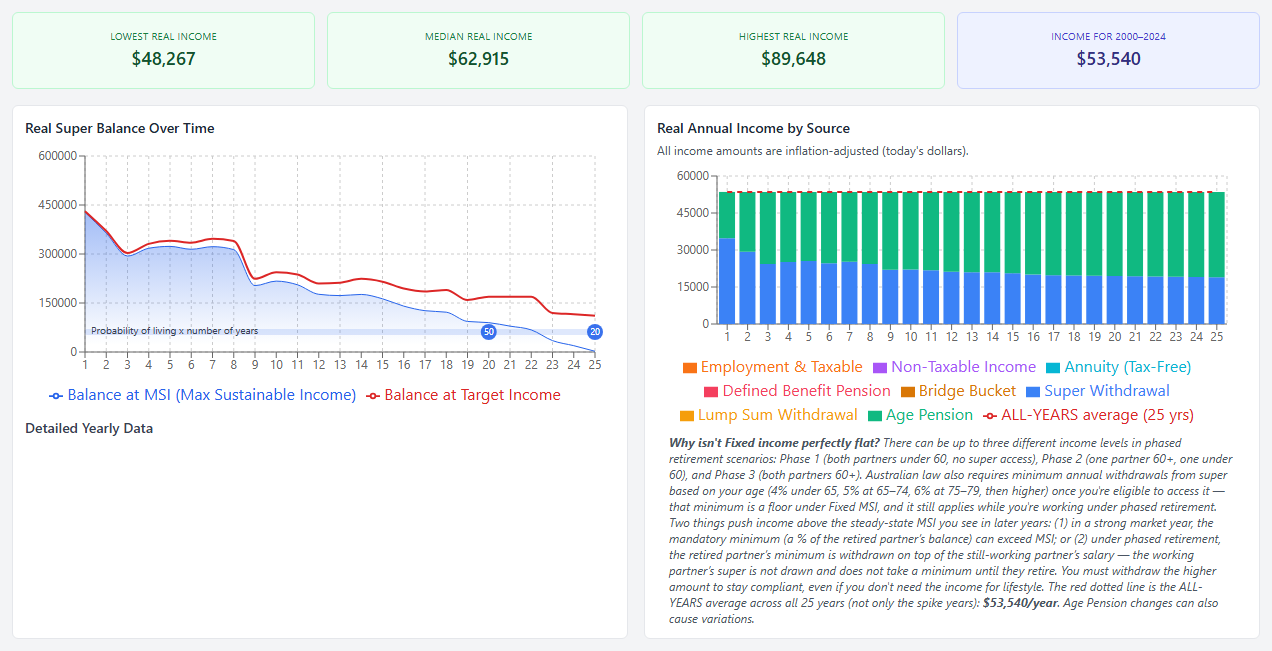
I ran a single homeowner, aged 67, with $500,000 in super and $40,000 outside super, through 2000 to 2024. The figure below is a constant real income: the same purchasing power each year for 25 years, in today’s dollars, while the super account is spent down toward zero at the end of the window. The $40,000 outside super sits in the means test. It is not the drawdown pool. Today’s Age Pension rules are applied to historical returns, which is an illustration, not a forecast.
| Assumption | Setting |
|---|---|
| Portfolio mix | 35% S&P 500, 15% Australian shares, 20% international shares, 20% bonds, 10% cash (80% franking on Australian equities) |
| Return series | Nominal total returns by sleeve, deflated with Australian CPI |
| Geometric real return, 2000 to 2024, before fees | About 3.1% a year on this mix |
| Administration | $52 + 0.10% of balance ($350 a year cap left on) |
| Investment fee | 0.5% of assets, no dollar cap |
| Transaction costs | 0.08% of balance |
| Age Pension real growth | 0.3% a year above CPI (calculator default; not a published DSS rate) |
Limitations
- Currency: the S&P 500 sleeve is unconverted USD total return (no AUD/USD adjustment), mixed with Australian CPI, so FX is missing from 35% of the portfolio; the international sleeve is not a fully hedged AUD series either.
- Free areas: asset and income free areas stay flat in real terms (CPI-only in statute; currently $333,000 for a single homeowner).
- 0.3% growth: the calculator’s default real pension growth lifts the maximum rate and the part-pension cut-off only; it is not a published DSS rate.
Turn the 0.3% pension growth off entirely and the with-pension figure falls from $53,540 to $52,441. The no-pension figure does not move.
On that path, constant real income with the pension is $53,540 a year. Without it, $22,852. On a smooth 3.1% real path with the same fees, the no-pension figure is about $27,100. Reverse the same 25 annual real returns and it rises to $30,835[1]. Across 300 random shuffles of those years, the median no-pension income is about $25,900 and the 10th percentile is about $19,300. The actual 2000 start ($22,852) sits only mildly below the median—about the 27th percentile, with roughly a few percentage points of sampling error at this shuffle count. Early losses in 2000 to 2002 and 2008 still hurt a spend-to-zero plan; better early years help it. Independent year shuffles also break serial correlation and volatility clustering, so they probably understate left-tail risk relative to real crash clusters. The planning-relevant number is that bad tail, not how far one historical start sits from the median.
From 20 September 2026 the maximum single Age Pension package is about $32,180 a year. The large gap between the with-pension and no-pension runs is only possible because the drawdown reduces assessable assets over time and the pension rises later. It is not a full pension from day one on a $540,000 starting asset position. And the $53,540 figure is not a permanent salary. After 25 years the account is spent. At about age 92, income falls to the Age Pension alone, about $32,180 in today’s dollars on current rates, or closer to $34,700 if the 0.3% real growth has compounded for the full window. That is a fall of roughly a third from the constant-drawdown years.
| Investment fee (uncapped %) | With the pension | Without it |
|---|---|---|
| 0.5% | $53,540 | $22,852 |
| 1.0% | $52,588 | $21,606 |
Lift the investment fee from 0.5% to 1.0% and the with-pension figure falls by about $950 a year on this path. Without the pension, the gap is about $1,250. Those percentages are the sort of line you take from a PDS fee table. Converting them into a household income path is the step the PDS does not take.
[1] An independent spend-to-zero check on the same real returns (fees only, no franking) gives about $30,700 when reversed, close to the $30,835 full-model figure.
Product first, household second
Open the shorter PDS for fees, insurance, and risks. Follow the incorporated guides when a line points there. Use YourSuper and MoneySmart for the product shortlist. Then put your ages, balances, home ownership, and a historical start year into a model that includes the Age Pension. That second step is what most “read the PDS” advice never names.
If you are still on the default MySuper option, the product question and the household question sit together. See the default MySuper article, the MoneySmart versus Advanced comparison, and insurance inside super for the premium side of the same disclosure pack.
A PDS is good for choosing a product. It cannot tell you what your household can spend. For that, run your own ages, balances and home ownership through something that includes the Age Pension, and treat the answer as a range across paths, not a figure that lasts forever.
Official sources
- MoneySmart glossary: Product disclosure statement (PDS)
- MoneySmart: Choosing a super fund (PDS among comparison tools; Savannah fee example)
- ASIC RG 168: Product Disclosure Statements: Disclosure and other obligations (December 2025), including RG 168.65
- Corporations Regulations 2001, Schedule 10D (shorter PDS form and page limits for super products)
- ASIC RG 97: Disclosing fees and costs (worked fee example on a $50,000 balance)
Run the household step
Open the same $500,000 start with a 0.5% investment fee and no dollar cap on that fee, then change the path or the fees. The first Advanced runs are free. Unlimited historical runs and PDF exports are $149 a year, or $14.99 a month ($179.88 over twelve months).
Open the calculator →No card required for the first run. Subscribe only if you keep using the full model.