The number everyone quotes
ASFA's August 2026 update of ATO data, current to June 2024, puts the median super balance at ages 60 to 64 at $236,126 for men and $174,655 for women. The difference is $61,471, or 26.0%.
Those medians count only people who have an account. In the same age group, 17.6% of women and 9.8% of men had no super at all. Across everyone aged 60 to 64, the shortfall is almost certainly wider than 26%. How much wider depends on how many of those without an account sit near the median.
The usual explanation is the pay gap, and the usual remedy is to close it. Both are true. Neither tells you what she will live on at 75. Most Australians retiring on these sums also draw the Age Pension, and the pension pays the same whatever caused the shortfall. If you are working out how much super you need to retire, the income difference in retirement is the number that matters, and for a homeowner it is much smaller than 26%.
Pay produces about half, in Treasury's model
The official pay gaps measure different things. The ABS figure, published by WGEA from the November 2025 survey, compares full-time adult ordinary time earnings and comes to 11.5%. WGEA's employer census uses total remuneration, counts part-time and casual staff on a full-time-equivalent basis, and puts the private-sector average at 21.1%. The 11.2% quoted from WGEA's March 2026 release is the gap at the median employer, a different measure. None of these counts the years a person is out of work.
The Retirement Income Review modelled the chain using stylised cameo workers, not the actual population. With women and men both working full-time, a 16.9% pay gap became a 17.4% shortfall in super at retirement and an 8.4% difference in annual retirement income. Once part-time and casual work was counted, the earnings gap was 31.4%, the balance shortfall 32.6%, and the income difference 9.6%. In that model the pay rate alone produced a little over half of the balance shortfall, and fewer hours produced the rest. Across the career break scenarios below, pay's share ranges from about 39% (two children, then part-time) to 69% (part-time from 55 to care for a parent). It shows the mechanism. It is not a breakdown of the actual 26%, and it leaves separation out entirely.
The Review's 16.9% was the full-time gap in total weekly earnings in November 2019. On the same ABS measure, May 2026 earnings were $2,286.70 a week for men and $1,963.90 for women, a gap of 14.1%. If that narrowing holds, pay rates would account for less of the shortfall for women retiring decades from now, though that is an extrapolation. A full-time measure also says nothing about hours, which produced nearly half of the modelled shortfall.
Career breaks add to the pay gap
The Review also modelled career breaks against a man working full-time throughout. Part-time earnings were set at 60% of full-time, and a woman returning from a break came back on the same nominal wage she left, which is a real pay cut.
| Woman's career pattern | Super shortfall at retirement | Retirement income difference |
|---|---|---|
| Full-time, no break | 17.4% | 8.4% |
| One child, two years off, then full-time | 29.6% | 10.3% |
| One child, two years off, part-time until the child is five | 32.6% | 11.1% |
| Two children, two years off for each | 41.2% | 13.4% |
| Two children, part-time until the youngest is five | 44.7% | 14.5% |
| Part-time from 55 to 67 to care for a parent | 25.2% | 9.5% |
One child and two years off, with no part-time work afterward, adds about 12 points to the 17.4% that pay alone produces. Two children with two years off for each adds about 24 points, more than pay itself.
The right-hand column moves far less. A 44.7% balance shortfall becomes a 14.5% income difference, about a third the size, because the pension does more of the work as savings fall. That is still a real difference, and still unfair.
Compare the child-then-part-time row with the carer row. Two years off plus three years at 60% of full-time pay is a loss of 3.2 full-time years. Twelve years at 60% is a loss of 4.8. The smaller loss, taken early, left the larger shortfall: 32.6% against 25.2% in balance, and 11.1% against 9.5% in income. The Review's note freezes nominal wages for years out of the workforce, which hits the child scenario and may not hit the carer scenario, since that one has no years completely out. If the freeze does not apply to caring, part of the result is the wage cut rather than the timing, and it runs in the same direction. The two rows differ in more than timing, so the table does not isolate it.
The Review noted that women took 93.5% of primary carer's leave, on 2019 WGEA data. Care is where the years go, and super has historically paid nothing for those years.
What has changed since the Review
Two of the system settings the Review flagged as widening the gap have since been changed. From 1 July 2022 the $450-a-month threshold was removed, so an employee no longer has to earn $450 in a month from one employer before the Superannuation Guarantee applies. That mattered most for women holding several small part-time jobs.
From 1 July 2025, the ATO pays super on government-funded Parental Leave Pay, at the Superannuation Guarantee rate, as a lump sum after the end of the financial year. That covers the paid weeks. It does not cover the unpaid months after the payment ends, or the years of reduced hours that follow, which the Review's table shows are the larger cost. The Review judged that the old exclusions widened the balance shortfall but had only a small effect on retirement incomes.
What the Age Pension does to the difference
To check the Review's income finding on today's rules, I ran the two medians through the Advanced calculator. Each is a single homeowner aged 67 with $40,000 of other assets, the calculator's default fees, a balanced mix of shares, bonds and cash, and 25 years of drawdown, to age 92. The calculator finds the level income, in today's dollars, that the balance and the pension can sustain on each historical 25-year path. The return data runs from 1928 to 2025, which gives 74 start years, 1928 to 2001.
| Man, $236,126 | Woman, $174,655 | Difference | |
|---|---|---|---|
| With the Age Pension, median path | $50,154 | $46,000 | 8.3% |
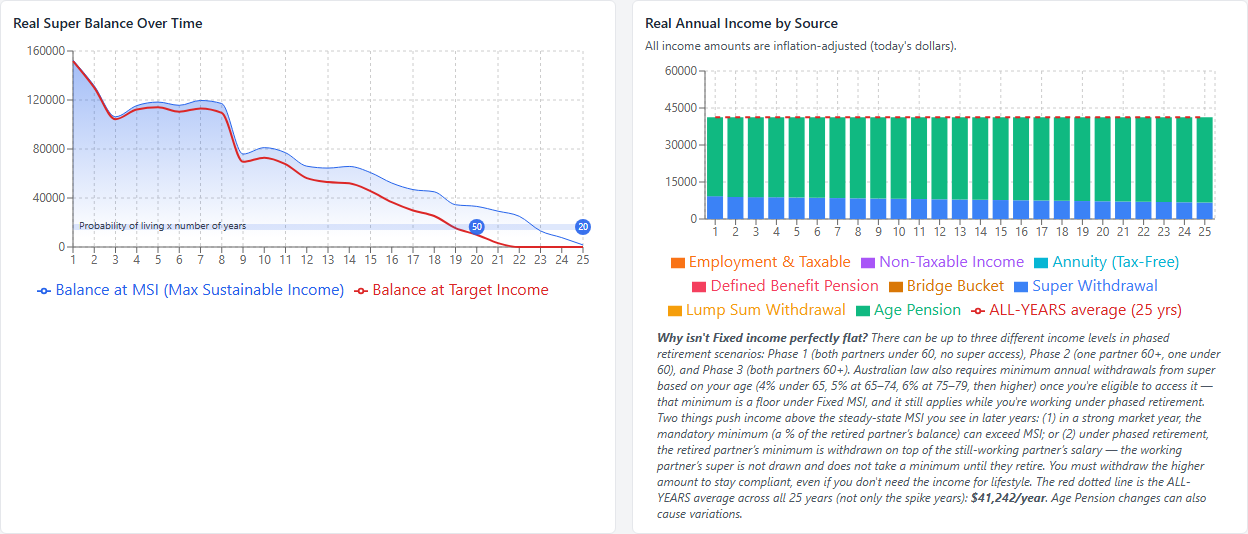
| With the Age Pension, 2000 to 2024 | $44,066 | $41,242 | 6.4% |
| With the Age Pension, worst path (1969 start) | $40,884 | $38,888 | 4.9% |
| Super only, median path | $17,917 | $13,201 | 26.3% |
| Super only, 2000 to 2024 | $10,999 | $8,033 | 27.0% |
Without the pension, the income difference tracks the balance shortfall, about 26%. With it, the median path shows $4,154 a year, 8.3%. Call that the median difference. It agrees in direction with the Review, whose scenarios closest to a typical woman show 9.6% to 11.1%. It does not confirm the Review's 8.4%, which is the full-time, pay-only case. On the worst path the difference is smaller still, because when markets do badly both balances run down and the pension pays more to both.
With $40,000 of other assets, neither loses pension under the assets test. The first-year deeming arithmetic shows the income test trims his pension more. The $560 average is the same gap seen over the whole path, so it adds no separate evidence. That $560 is about an eighth of the super-only difference ($4,716). The reason the difference shrinks from 26% to 8% is that the pension is large and paid to both. The extra $61,471 of super earns and pays out, and it also costs him some pension.¹
Comparing the runs with and without the pension, roughly four-fifths of her income on the 2000 to 2024 path comes from the pension: $41,242 in total, against $8,033 from super alone. That is a comparison of two runs, not the split inside a single year.
This run has limits. The balances are medians at 60 to 64, applied at 67 without the growth and contributions of the years between. Both are given the same $40,000 of other assets, though she plausibly has less. Cutting hers to $20,000 raises her income by $154, because the income test trims slightly less pension. The 74 paths overlap, so they are not 74 independent tests. And the calculator is my own product, which I sell. Its method is historical returns run through current pension rules, and the Review's independent modelling points the same way.
Living longer, retiring earlier
Women live longer, though the difference at birth overstates the difference at retirement. ABS life tables put life expectancy at birth at 85.1 years for women and 81.1 for men in 2022 to 2024, unchanged from 2021 to 2023. At age 60, in the ABS 2021 to 2023 tables, a woman could expect another 27.1 years and a man another 24.2, a difference of 2.9 years. The Review found that women also retire earlier, so their savings have to last longer.
At the median woman's balance, a longer life costs less than intuition says. Shortening her drawdown from 25 years to 20 lifts the median-path income from $46,000 to $47,433, a difference of $1,433 a year, or about 3%. On super alone, 25 years supports $13,201 a year and 20 years supports $14,634, so the longer horizon costs about 10%. The pension is paid for life, so the extra years are mostly funded by it. The Review found the same pattern: two extra years of life cost 0.6% of retirement income at a $200,000 balance and 4.0% at $800,000. Longevity is a bigger problem for wealthier women, who rely more on their own savings. The Review also found women are more likely than men to draw at the minimum drawdown rate, and said the cause is unknown.
Retiring earlier is a different matter. The tables above retire both at 67. The Review says women retire earlier, and it does not say by how much, so two years is an illustration. If she retires at 65 and he retires at 67, her median-path income to 92 is $41,293 against his $50,154. That is $8,861 a year, about 17.7%, roughly double the median difference. Retiring early is not a cost that falls on women as such. Retiring both at 65, with super alone covering the two years before the pension starts, costs her about $4,700 a year and him about $4,400, and leaves them $4,503 apart. To the extent women do retire earlier, the pension closes less than the both-at-67 table suggests.
Single, renting, after a separation
Every row so far assumes a homeowner, and that is the assumption most likely to fail after a separation.
The Review cited 2016 Census data showing that around 19% of women aged 60 to 64 were divorced and single, against 15.4% of men, up from about 6.7% and 6.3% in 1991. The median age at divorce had risen to 43.2 for women. Those figures are the Review's. I could not find the same breakdown in the 2021 Census. CEPAR (2019, p. 9), which the Review cites, found that nearly a quarter of divorces result in a loss of home ownership. That figure is not split by sex. Divorced people, particularly divorced women approaching retirement, are a larger share of older renters than of the population.
The Review, citing Brown (2016), says that five years after divorce, women with dependent children had substantially less super than married women with children, and that recently divorced men with children had more super, on average, than married men. Brown's women were aged 25 to 55, so this is working-age evidence applied here to people near retirement. The Review's footnote 151 states that age limit for the women and does not say the men's figure uses the same ages.² Super can be split in a property settlement, and the Review found that it often is not. The guide to super and divorce splitting covers how the split works.
Being divorced and single is not the same as renting, and I could not find an official count of women who are both single and renting at retirement age. Across everyone aged 55 and over, partnered or not, renting is not a women's problem in particular. In 2021 Census analysis by Housing for the Aged Action Group, 11% of both men and women aged 55 and over, counted at home in private dwellings, rented from a private landlord. Women were slightly more likely than men to own outright, 59% against 57%.
To see what renting does, I ran the same two medians as single renters, at illustrative rents of $250, $400 and $550 a week, held level in today's dollars. The calculator adds Rent Assistance to the pension but reports income before rent, so I subtracted the rent to get what is left to live on.
| Median path, to age 92 | Woman, $174,655 | Man, $236,126 | Woman behind the homeowner man |
|---|---|---|---|
| Homeowner | $46,000 | $50,154 | $4,154 |
| Renting at $250 a week, after rent | $38,987 | $43,172 | $11,167 |
| Renting at $400 a week, after rent | $31,187 | $35,372 | $18,967 |
| Renting at $550 a week, after rent | $23,387 | $27,572 | $26,767 |
The model applies its default 0.3% real growth to Rent Assistance too, so the assistance averages about $6,000 over 25 years against a $5,819 statutory maximum today. Rent Assistance is indexed to the CPI, so that rise flatters renters by about $200 a year. Every extra dollar of rent above the cap falls on the renter. The higher non-homeowner free area does nothing for her, because her assets are already under the homeowner free area.³
A renting man is in the same position. At each rent he loses almost exactly what she does against owning: about $7,000, $14,800 and $22,600 a year. Those penalties are about $200 a year larger once Rent Assistance is held to CPI. Among renters they stay about $4,200 apart. Being the median woman rather than the median man accounts for about $4,200 of each figure in the right-hand column, and the rest is rent.
The table deducts rent and deducts nothing for owning, and outright ownership is the best case for the owner. Rates, insurance and maintenance are real costs. An illustrative $4,000 to $6,000 a year, which is not a measured cost, would cut the $250-a-week penalty from about $7,000 to between $1,000 and $3,000, below the median difference. At $400 a week the penalty is still about $9,000 to $11,000 after that allowance, and at $550 a week about $17,000 to $19,000. The allowance puts the point where renting costs more than the median difference at about $270 to $310 a week, so around $300. The $400 row is comfortably past it. A divorced woman who kept the house may still have a mortgage, and the repayments could erase the owner's advantage in this comparison. The owner who is mortgage-free also keeps an asset the assets test exempts, often worth far more than the $61,471 super shortfall, so the wealth comparison is wider than the income comparison.
These rents are illustrations, not market medians, and private rents in many places are higher. The rows also give each renter the median balance. A woman who lost the home in a separation may have less super than that, so the rows probably understate the damage. The homeowner and non-homeowner comparison sets out the pension rules, and the calculator takes rent as an input if you want to run your own.
Partnered women face the same question later. A couple's pension is assessed on combined assets, and a widow moves to the single rate with whatever the household held. The couples versus singles comparison shows how the single and couple rates compare.
What to check if you are behind
The balance on the statement is the start of the question. The more useful questions are whether you will own your home outright at 67, whether you will be single, and how many working years you have left. A $175,000 balance with a paid-off house is mostly a pension question. The same balance while renting is a housing question first.
Couples can already move money between them. A member can split concessional contributions to a spouse, and a contribution to a low-income spouse can earn a tax offset. The spouse contributions guide sets out the limits. A woman returning to work after a break, with a total super balance under $500,000, can also use unused concessional cap amounts from the previous five years.
None of that requires waiting for pay rates to close. The superannuation calculator runs a plan on historical returns with the Age Pension included, so you can see whether what matters in your case is $61,471 of balance, the median difference of a few thousand dollars a year, or the rent once the costs of owning are allowed for.
The bottom line
The 26% balance shortfall at 60 to 64 is real, and it is almost certainly wider, because it leaves out the women with no super at all. It reflects a working life of lower pay, fewer hours and more years out. For homeowners who both retire at 67, the Age Pension shrinks the 26% to about 8%, or $4,150 a year. If she retires an illustrative two years before him, it is about $8,860.
A smaller headline shortfall is not the same as enough. Both balances are small next to the pension, which is why the median difference is small, and the result holds only while pension settings stay where they are. The extra $61,471 raises her income by $4,154, about a tenth of the $46,000. Her super on its own supports $13,201 of that.
Housing costs more than the median difference once the rent is around $300 a week or more, even after an illustrative allowance of several thousand dollars a year for owning. A renting man loses about as much. The Review's evidence suggests separation leaves women worse off, and that evidence is not a count of who rents. The woman to worry about is 67, single after a separation, and renting. At $400 a week she has nearly $15,000 a year less than a homeowner with the same super before any cost of owning is deducted, and no change to pay rates alone will reach that.
¹ Opening year, using rates from 20 September 2026. Deeming is 1.75% on the first $66,800 and 3.75% above it. His $276,126 is deemed at about $9,019, about $3,143 over the $5,876 income-test free area, a cut of about $1,570. Hers, on $214,655, is a cut of about $420. The asset-test free area for a single homeowner is $333,000. The $560 is his pension on the median path ($50,154 minus $17,917) against hers ($46,000 minus $13,201). That is the same gap as $4,716 minus $4,154, which is about an eighth of $4,716. It is the path-long version of one difference, not a separate measurement of the income test.
² The Review's words are that recently divorced men with dependent children had more superannuation assets, on average, than married men. A child was defined as under 16, and the super comparison was adjusted for age, income and family structure.
³ Before rent, her sustainable income is $51,987, which is $5,987 above the homeowner's $46,000. All three rents are above the cap, reached at about $456 a fortnight, so they get the same assistance. The model applies its pension-growth setting, 0.3% a year in real terms, to Rent Assistance as well. The runs are in today's dollars, and 0.3% is the default on that setting, not the statutory pension indexation rule. Held flat in today's dollars, the $5,819 maximum would not grow, which is about $200 a year less than the path in the table. Parliament has also made one-off real increases, in 2023 and 2024. Those are already in today's maximum. The ongoing indexation is the CPI.
Official sources
- Treasury: Retirement Income Review Final Report, Chapter 3 Equity. Tables 3B-1 and 3B-2 (pay, part-time and career break gaps), Table 3B-3 (life expectancy), and the divorce findings.
- ATO: Paid Parental Leave Superannuation Contribution
- Housing for the Aged Action Group: Ageing in a housing crisis (2021 Census). 11% of men and of women aged 55 and over, counted at home in private dwellings, rented privately. Outright ownership was 57% for men and 59% for women.
- Brown (2016), as cited in the Retirement Income Review, Chapter 3, including footnote 151. The Review does not give a URL. The footnote limits the analysis of women to ages 25 to 55.
- CEPAR: Chomik and Yan, Housing in an ageing Australia: Nest and nest egg? (research brief, November 2019), p. 9. Nearly a quarter of divorces result in a loss of home ownership. The Review cites this as CEPAR, 2019.
- Department of Social Services, Social Security Guide 5.1.7.10: Rent Assistance thresholds and maximum rates are indexed to the CPI on 20 March and 20 September. One-off real increases were also made in 2023 and 2024.
- Federal Register of Legislation: Treasury Laws Amendment (Enhancing Superannuation Outcomes For Australians and Helping Australian Businesses Invest) Act 2022, Schedule 1 (removing the $450 monthly threshold)
- ATO: Spouse super contributions, splitting and the spouse tax offset
- ABS: Life expectancy, 2022 to 2024
- WGEA: ABS gender pay gap data (11.5%, November 2025)
- WGEA: Gender pay gap data (21.1% private-sector total remuneration average)
- WGEA: 2026 employer gender pay gaps release (11.2% is the median employer's gap)
- ABS: Average Weekly Earnings, May 2026 (full-time adult total earnings by sex)
- ABS: life expectancy at 60, 2021 to 2023 (27.1 years for women, 24.2 for men)
- ASFA: An Update on Superannuation Account Balances, 2026 Edition (ATO data to June 2024)
- MoneySmart: Age Pension
Run your own numbers
The chart is the median woman's balance on the 2000 to 2024 path. Put in your own balance, home ownership and partner, and see how much of the income comes from the pension. Your first Advanced run is free, and you get a second free run when you enter your email. Unlimited historical runs and PDF exports are $149 a year, or $14.99 a month ($179.88 over twelve months).
Open the calculator →General information only. This article is educational and does not consider your objectives, financial situation, or needs. The balances are ATO medians for people aged 60 to 64 with super at June 2024, not your balance. The calculator results use historical returns, today's Age Pension rules, single people with $40,000 of other assets retiring at 67 unless stated, illustrative rents held level in today's dollars, and the calculator's default fees. Past returns do not predict future returns, and pension rules change. The career break figures are Treasury cameo modelling from the 2020 Retirement Income Review. The $4,000 to $6,000 ownership allowance is an illustration, not a measured cost.
SuperCalc Pro Pty Ltd does not hold an Australian Financial Services Licence (AFSL). Seek advice from a licensed financial adviser before making a contribution, splitting super, or deciding when to retire.