Why start with housing, not the statement
Retirement advice in this country still orbits the super statement: how much do you need, how close are you, what return closes the gap. At the balances modelled here, whether the house is paid off or the rent keeps coming moves living standards more than another hundred thousand in the fund.
Grattan Institute’s February 2025 report on renting in retirement (Overview, p. 3) states that three in four retirees own their home. Among private-market renters, about two in three live in poverty on Grattan’s measure, including more than three in four single women who rent. Half of retirees who rent have less than $25,000 in savings.
Among households headed by people aged 65 and over, custom ABS Census work reported by The Conversation put home ownership (outright or with a mortgage) at 79.4% in 2021, up slightly from 78.4% in 2016. The runs below compare an outright owner with a private renter, so the Census figure is a backdrop, not the same group. Ownership has fallen sharply among poorer Australians approaching retirement: Grattan has the poorest 40% of 45 to 54 year-olds dropping from 68% owners in 1981 to 54% in 2021. Those households are next in line for retirement.
How Centrelink treats owners and renters
Centrelink’s Age Pension assets test does not count the principal home. Everything else that is assessable (super in retirement phase, bank accounts, shares, a car, household contents, an investment property) sits under a free area that depends on whether you are treated as a homeowner.
From 1 July 2026 those free areas are $333,000 for a single homeowner and $600,000 for a single non-homeowner. Couples sit at $499,000 and $766,000 combined. The gap for singles is $267,000. From 20 September 2026 the published part-pension cut-offs (without Rent Assistance) are $745,750 and $1,012,750 for singles, and $1,121,000 and $1,388,000 for couples. Services Australia notes that receiving Rent Assistance raises the cut-off further. The homeowner versus non-homeowner limits article walks through those tables. The cut-offs do not bind at $440,000 in assessable assets ($400,000 super plus $40,000 other). The free areas do: the homeowner is about $107,000 over theirs and the renter is under theirs, which is where the renter’s higher pension before rent comes from.
Non-homeowners get the higher free area because they have no exempt house. They can also receive Commonwealth Rent Assistance if they are on the pension and pay enough rent. From 20 September 2026 the maximum for a single is $223.80 a fortnight, about $5,819 a year. Couples combined get a slightly lower maximum. Rent Assistance pays 75 cents for each dollar of rent above a threshold, up to that cap. The single maximum is reached at $456.20 a fortnight, about $228 a week. Above that, every extra dollar of rent is the household’s. Rent Assistance is indexed to the CPI, not to market rents. Grattan noted that rents paid by recipients have risen nearly 1.5 times faster than the maximum rate since 2001.
Same $400,000: owner versus renter
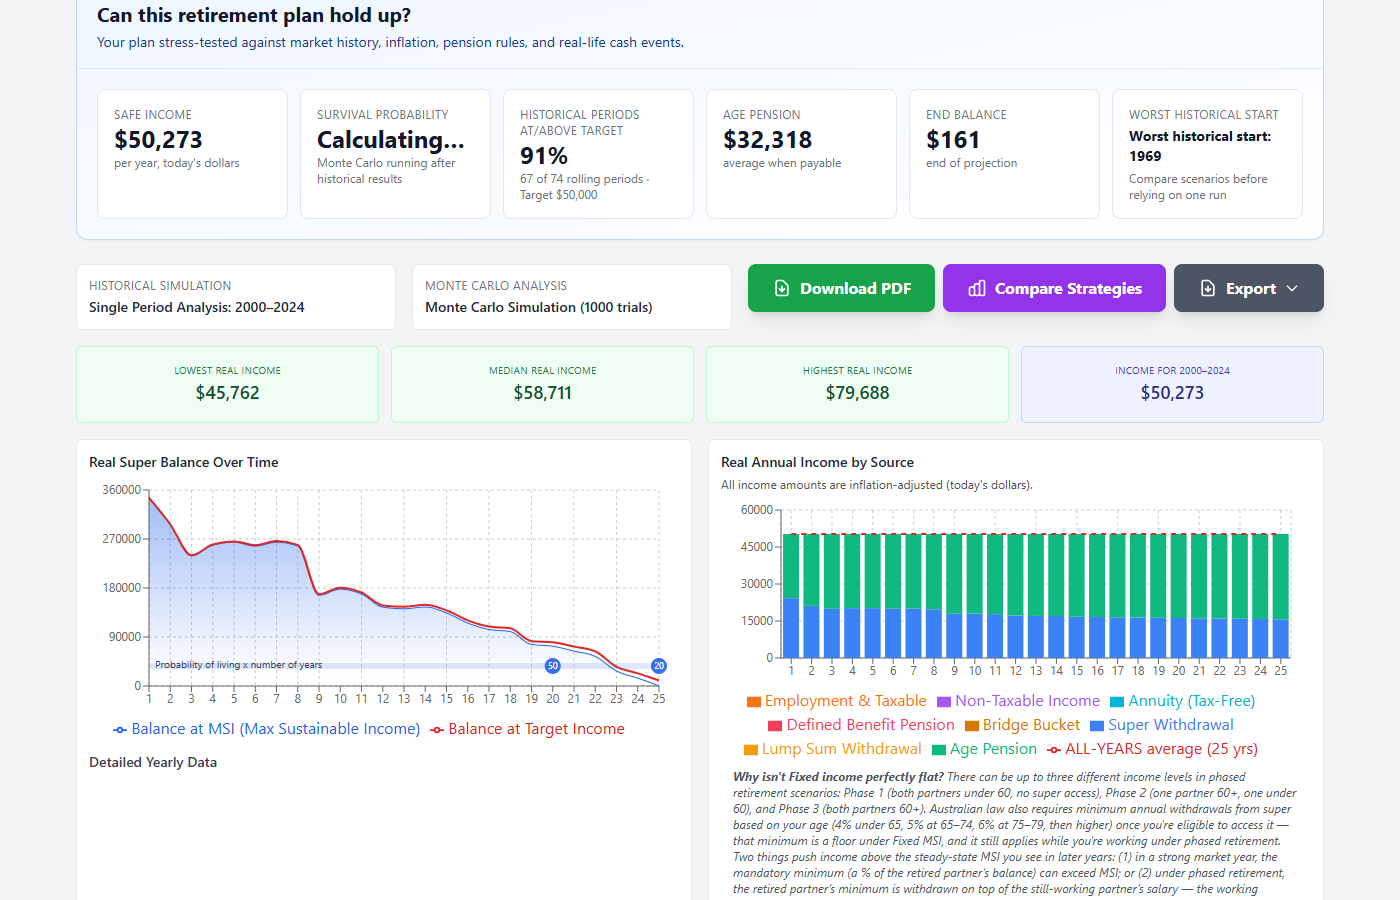
I ran a single person aged 67 through the Advanced calculator with $400,000 in super and $40,000 of other assets, a balanced mix (35% S&P 500, 15% Australian shares, 20% international shares, 20% bonds, 10% cash, 80% franking on Australian equities), default fees (including a 0.5% investment fee), and a 25-year drawdown to age 92. The calculator finds the constant real income, in today’s dollars, that the balance and the Age Pension can sustain on each historical start year from 1928 to 2000. That is 73 overlapping windows, not 73 independent careers: neighbouring starts share most of their return years, so the effective sample is closer to a handful of market regimes. The 35% S&P 500 sleeve also leans on US history. The pension growth setting is the calculator default of 0.3% a year in real terms, which is not a published DSS rate.
For renters, Rent Assistance is included in the pension where the rent qualifies. The calculator reports sustainable income before rent. The table subtracts the rent to show what is left to live on. Ownership costs (rates, insurance, maintenance) are not deducted from the homeowner row. That flatters the owner. An illustrative $4,000 to $6,000 a year for owning would narrow, but not erase, the gaps at $400 a week and above.
The median column is the middle of those 73 path incomes. Each path spends the account to about zero at 92, so on half of starts that median dollar amount would have failed earlier. The 2000 to 2024 column is one concrete window, and it is the fairer headline for a single figure.
| Case ($400,000 super, $40,000 other assets) | Median path | 2000 to 2024 |
|---|---|---|
| Homeowner | $58,711 | $50,273 |
| Renter, $250 a week, before rent | $65,548 | $56,450 |
| Renter, $250 a week, after rent | $52,548 | $43,450 |
| Renter, $400 a week, after rent | $44,748 | $35,650 |
| Renter, $550 a week, after rent | $36,948 | $27,850 |
Before rent, the renter looks better: the higher free area and Rent Assistance lift reported income by about $6,800 in the median column. After $250 a week that advantage is gone and the renter is about $6,200 behind. At $400 a week the gap is about $14,000 on the median start and about $14,600 on 2000 to 2024. At $550 a week it is about $21,800. All three weekly rents sit above the Rent Assistance cap for a single, so the before-rent figures are the same and only the rent subtraction changes.
$400 a week is $20,800 a year. Maximum Rent Assistance is about $5,800, so the net housing bill is still about $15,000 a year. Across the two tables, moving a homeowner from $400,000 to $500,000 raises median income by about $4,200, and moving a renter the same way raises after-rent income by about $5,800. The rent bill is larger than either step.
How much extra super closes the rent gap
One reply is that the renter should simply save more. The table below keeps $400 a week of rent and changes only the starting balance.
| Median path incomes | Income |
|---|---|
| Homeowner, $250,000 super | $50,726 |
| Renter, $500,000 super, after $400 a week | $50,569 |
| Homeowner, $500,000 super | $62,955 |
| Renter, $400,000 super, after $400 a week | $44,748 |
A homeowner with $250,000 and a renter with $500,000 after $400 a week land within about $160 a year of each other. Give both $500,000 and the homeowner is about $12,400 ahead of the renter after rent ($62,955 against $50,569).
The table does not include a separate run that lands exactly on the $14,000 gap. From the two renter rows, each extra $100,000 raises after-rent income by about $5,800. Closing a $14,000 gap against a $400,000 homeowner therefore takes roughly another $240,000 of super on top of $400,000. That is an extrapolation from those two points, not a third simulation.
These renter balances are a best case. Grattan finds half of renting retirees have under $25,000 in savings. Modelling $400,000 to $500,000 tests whether even a well-funded renter keeps up once rent is paid. For most of the group in the report, the shortfall starts earlier.
What the comparison leaves out
Equal balances at 67 are artificial. An owner spent decades on mortgage payments; a renter who invested that difference could arrive with a much larger balance, depending on rents, returns, tax, and discipline. The thesis here is conditional on matching super at retirement. It does not claim that owners and renters typically arrive with the same statement.
The runs also assume an outright owner and a private renter. A mortgage in retirement can erase the owner’s advantage for years. Social housing is a different case again. Grattan (Overview, p. 3) reports that about a third of today’s renting retirees live in social housing, where rents are capped at 30% of income, and that far fewer can expect to do so in future because there is not enough stock. Partnered households face combined assets tests and a different Rent Assistance maximum; the couples versus singles guide covers the rate structure.
After separation, the woman who keeps the house and the woman who rents are not in the same retirement even when their balances look close. See Women’s Super Gap: It’s Not Just Pay and super and divorce splitting.
I sell the calculator used here. The method is historical returns run through current Age Pension rules. The direction matches Grattan’s evidence that private renters are the group left behind. The dollar figures are educational projections on stated assumptions, not a forecast of your spending power.
Where that leaves the statement balance
The principal home is exempt from the assets test. Non-homeowners get a higher free area and a capped rent top-up. At $400 a week of private rent, with equal super at 67, that still leaves the renter about $14,000 a year behind an outright owner before any cost of owning is deducted, and an extrapolation puts the figure on the order of another $240,000 of super to close the gap. The statement still matters. At equal balances, tenure moves income more than another hundred thousand in the fund. Most renting retirees start well below the balances used here.
If you want how much super you need to retire, run the number twice: once as a homeowner and once as a renter at a rent you believe.
Official sources
- Services Australia: Assets test for Age Pension (free areas and cut-offs, including homeowner and non-homeowner)
- Services Australia: How much Rent Assistance you can get
- Grattan Institute: Renting in retirement: Why Rent Assistance needs to rise (February 2025 PDF)
- The Conversation: custom ABS Census analysis on home ownership at ages 65+ (79.4% in 2021)
- ABS: Housing Census, 2021
Compare owner and renter on your balances
Start with the $400,000 homeowner case, then untick homeowner and enter your fortnightly rent. The first Advanced runs are free. Unlimited historical runs and PDF exports are $149 a year, or $14.99 a month ($179.88 over twelve months).
Open the calculator →No card required for the first run. Subscribe only if you keep using the full model.