From 20 March 2026 both deeming tiers rose by half a percentage point. For a single with $570,000 in combined financial assets, that added $2,850 to deemed income before any change in actual bank rates. Services Australia still does not ask what those accounts actually paid. It applies deeming rates to the balance and feeds the result into the Age Pension income test. The home stays exempt. Financial assets outside the home, including most account-based pensions started after 1 January 2015, do not. When cash yields sit below the assumed rates, part-pensioners can lose entitlement on income that never arrived. When growth portfolios pay strong distributions, the same rule can leave deemed income below what hit the bank. The income test and assets test still run in parallel, and the lower result governs payment.
Deeming rates from 20 September 2026
From 20 September 2026 the lower deeming rate is 1.75% and the upper rate is 3.75% (up from 1.25% / 3.25% that applied from 20 March 2026). Thresholds remain $66,800 for a single and $110,600 combined for a couple from 1 July 2026. Financial assets above the threshold attract the higher rate on every dollar in that upper slice, not just the marginal dollar in an incremental sense. The full mechanics are in the dedicated deeming explainer and the March 2026 rate-change note.
| Household | First threshold | Rate below | Rate above |
|---|---|---|---|
| Single | $66,800 | 1.75% | 3.75% |
| Couple (combined financial assets) | $110,600 | 1.75% | 3.75% |
The March 2026 step added 0.5 percentage points to each tier. On a large financial asset base that is a straight increase in deemed income even when term deposit rates on offer at the bank did not move on the same day.
When deeming exceeds cash yield
Take a single homeowner aged 72 with $420,000 in financial assets held mostly in cash and offset accounts, plus $150,000 in account-based pension phase. For most pensions started after 1 January 2015, Centrelink deems both pools together. Combined financial assets of $570,000 produce deemed income of about $20,039 a year under current rates: 1.75% on the first $66,800 ($1,169.00) and 3.75% on the remaining $503,200 ($18,870.00).
If that entire $570,000 base actually earns about 1% in total, cash flow is roughly $5,700. The income test then treats about $11,500 of annual income as present when it did not arrive as spendable cash. Pension fortnights shrink accordingly unless the assets test is already the binding constraint.
That profile fits retirees who sold growth assets during a scare, parked proceeds while deciding what to do next, or kept a large buffer after downsizing. The home stays exempt. Financial assets outside the home, including most account-based pensions, do not.
When actual returns exceed deeming
The same rule cuts the other way. A couple holding $600,000 in diversified growth assets might receive $30,000 in dividends and distributions in a strong year while deemed income on that balance is closer to $17,400 under current thresholds and rates. The income test ignores much of the cash flow that actually arrived. Payment can be higher than a literal reading of bank deposits would suggest.
Policy makers accepted that asymmetry decades ago because auditing every portfolio was impractical. The March 2026 increase tilted the formula back toward the conservative case at a moment when many retirees still hold elevated cash after the rate-hiking cycle. Whether that tilt was intended is a political question. For modelling, the numbers are simply live law.
Why the March 2026 step stung cash-heavy households
On the same $570,000 combined base, deemed income under the old 0.75% / 2.75% pair was $14,391 a year ($481.50 on the first $64,200 plus $13,909.50 on the remainder). After the March 2026 rate change (still on the then $64,200 threshold) it was $17,241. That was $2,850 of extra deemed income without selling a share or renewing a term deposit. From 1 July 2026 the same balance at the then-current 1.25% / 3.25% rates on the indexed $66,800 threshold was about $17,189. From 20 September 2026 at 1.75% / 3.75% it is about $20,039.
Part-pensioners near the taper band can feel that shift quickly because income test free areas are tight. A few thousand dollars of deemed income can move a fortnightly payment by more than the household sees in its actual interest line. The rate change took effect from 20 March 2026, so entitlement letters could move before living costs changed.
Mandatory drawdowns that spill surplus cash into the bank, described in the mandatory drawdown article, can push more dollars into the upper deeming tier even when spending stayed flat.
What simplified calculators miss
Fund calculators sometimes apply actual portfolio yield to the Age Pension income test, or skip deeming entirely. Spreadsheet models built on a fixed percentage spend can treat pension entitlement as if Centrelink cared about coupon payments rather than deemed balances. Single-year government planners can apply deeming correctly for a snapshot while leaving out how deeming, minimum pensions, and market returns interact over decades. That gap is one reason we wrote the separate calculator comparison piece.
Fixed-income retirement models that ignore deeming will overstate Age Pension for cash-heavy households and understate it for growth-heavy portfolios with modest dividends. The error shows up in the years after a deeming change, after a large lump sum lands in cash, or when minimum pensions refill an offset account.
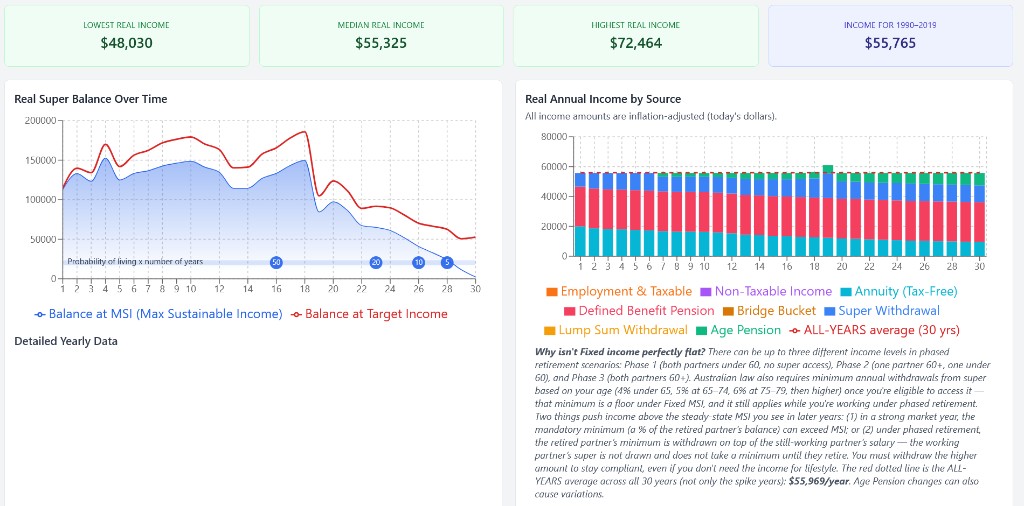
Advanced Calculator output (fictional single, age 72, $420,000 other assets plus $150,000 super, $570,000 combined for deeming, homeowner, 1990 historical start). Not a real household.
The screenshot uses the same cash-heavy inputs as the link above. If your tool never shows deemed income separate from actual portfolio yield, check whether it implements Services Australia deeming at all. For households where cash buffers are deliberate, that check matters more than fine-tuning expected return assumptions.
Planning questions people raise with advisers
Households respond in different ways when deemed income exceeds cash yield. Some accept lower pension while keeping liquidity. Some discuss moving part of a buffer into assets with different test treatment, which carries risk and product rules that belong in licensed advice. Others time large purchases to reduce financial assets before an entitlement review, which has its own limits and reporting obligations.
What you can do without advice is quantify the gap. Calculate deemed income on today’s balances. Compare it with actual interest and distributions. Run the forward path with deeming switched on so a future rate change or cash inflow does not arrive as a surprise in a static spreadsheet. The Advanced Calculator includes deeming in its Age Pension engine and updates the rate step on 20 March 2026 within historical runs that cross that date.
Official sources
See deeming in a full retirement path
Run the cash-heavy single scenario free. The Advanced Calculator applies deeming tiers, both pension tests, and historical returns in one model. Unlimited historical runs and PDF exports are $149 a year, or $14.99 a month if you would rather not commit upfront.
Run the deeming scenario →No card required for the first run. Subscribe only if you keep using the full model.
General information only. This article is educational and does not consider your objectives, financial situation, or needs. It does not recommend that you open, close, or change any super fund or product. SuperCalc Pro Pty Ltd does not hold an Australian Financial Services Licence (AFSL). Deeming rates, Age Pension thresholds, and super rules change. Consider licensed financial advice, and confirm current rules with Services Australia and the ATO, before making retirement decisions.