Open a newspaper in Budget week and the same fight reappears. One side says compulsory super would collapse without concessional tax rates. The other says the Commonwealth is subsidising large balances that never needed a subsidy. Both camps talk past each other because they argue from slogans. The measurable question is narrower: against a personal income-tax benchmark, who receives the dollar value of the contribution and earnings concessions?
That is what Treasury’s Tax Expenditures and Insights Statement (TEIS) tries to answer. The piece below lays out the latest published distribution, explains why the pattern looks the way it does, and notes the two levies (Division 293 and Division 296) that already clip the top. It is not a case for abolishing super tax breaks, and it is not a case for expanding them. It is a map of who gets the benefit under current law.
What “concession” actually means in the TEIS
Treasury does not measure “how much tax super paid.” It estimates revenue forgone relative to a benchmark in which contributions and fund earnings would sit in personal taxable income and face ordinary marginal rates. Against that benchmark, taxing contributions and accumulation earnings at 15%, and retirement-phase earnings at 0%, looks cheap. The gap between the benchmark and the actual rate is the “concession.” A different counterfactual, for example a consumption-tax lens or a world with no earnings tax inside super at all, would shrink these measured concessions. The TEIS numbers below are large because Treasury chose the personal-rate benchmark, not because that is the only coherent way to score the system.
Two big buckets matter for most readers. Concessional taxation of contributions (employer and personal, TEIS items C2 and C3 combined) is estimated at about $32.2 billion of revenue forgone in 2025–26 and $34.4 billion in 2026–27. Concessional taxation of fund earnings, including the capital-gains treatment inside funds (C1 and C4 combined), sits around $28.5 billion and $30.4 billion in those years. Markets move the earnings line around; policy announcements revise both. Treat the dollars as order-of-magnitude budget cost, not a household invoice.
The flat 15% contributions rate is more valuable when your personal marginal rate is 37% or 45% than when it is 16% or 30%. A larger balance produces more earnings, so the same 15% / 0% earnings rules generate a larger absolute concession for people who already hold more. That mechanical fact, not a conspiracy, drives most of the distribution charts.
Contribution concessions: where the dollars go
Distributional analysis in the 2025–26 TEIS uses 2022–23 ATO data. For contributions, people with above-median taxable income received 87% of the measured benefit. The top income decile alone received 32%. Around 13 million people were affected; most, but not all, came out ahead of the personal-tax benchmark.
The bottom of the income distribution can show a negative “benefit.” If your marginal personal rate sits below 15%, paying 15% on concessional contributions is worse than the TEIS benchmark, not better. The Low Income Super Tax Offset (LISTO) is designed to rebate some of that contributions tax for eligible low earners, but LISTO is scored as direct expenditure, not inside the TEIS concession charts. From 1 July 2027 the announced LISTO settings lift the maximum offset to $810 and the eligibility threshold to $45,000. Until then, the published charts understate support for the lowest earners who actually receive LISTO.
Gender shows up in the averages. In 2022–23, men received an average contribution concession benefit of about $2,490 against about $1,610 for women. Higher average male incomes, larger concessional flows, and higher marginal rates explain most of that gap. It is the same structural story as the median balance gap near retirement, expressed in tax-expenditure dollars instead of account balances.
| Metric (contributions, 2022–23) | Share / figure |
|---|---|
| Benefit to above-median incomes | 87% |
| Benefit to top income decile | 32% |
| Average benefit, men / women | ~$2,490 / ~$1,610 |
| Combined revenue forgone (2025–26 est.) | ~$32.2 billion |
Earnings concessions: balances and age do the work
Earnings concessions are even more skewed toward higher incomes and older cohorts, because balances compound for decades and retirement-phase earnings sit at 0%. In 2022–23, above-median incomes received 79% of the earnings concession benefit; the top decile received 38%. About 51% of the benefit went to people aged 60 or older. Zero tax on pension-phase earnings concentrates measured benefit among people who have already entered retirement with larger accounts.
Non-lodgers can show a negative earnings result in the TEIS sense: they paid fund tax that, on average, exceeded what they would have paid if the same earnings had been taxed at their personal rates. Again, the chart is a benchmark comparison, not a statement that low-income members “lose money” relative to having no super at all.
Independent analysis often compresses contributions and earnings into one sentence. Grattan Institute’s widely cited estimate is that roughly two-thirds of the combined value of super tax breaks goes to the top 20% of income earners. Treasury’s official charts are by decile and by concession type, not by that exact top-20% cut. The direction of travel is the same either way: absolute dollar benefits rise with income and balance.
Division 293 and Division 296: what already clips the top
The system is not a pure flat 15% forever for every dollar. Division 293 adds another 15% on concessional contributions once income plus those contributions exceed $250,000, so the effective rate on the excess is 30%. That still leaves a gap to the top personal rates, but it is no longer a 15% ticket for every high earner’s full concessional flow. Details sit in the Division 293 explainer.
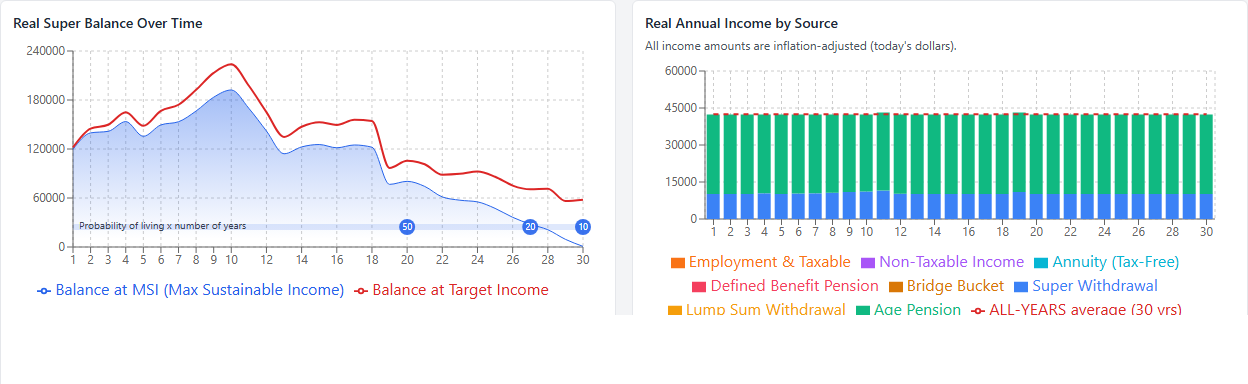
Division 296, from 1 July 2026, raises the headline tax on earnings attributable to Total Super Balance between $3 million and $10 million to 30%, and to 40% above $10 million, with both large-balance thresholds indexed. The earnings base is Division 296 fund earnings under the enacted formula in the Treasury Laws Amendment (Building a Stronger and Fairer Super System) Act 2026 (broadly the fund’s tax result, not the earlier Total Super Balance movement design that would have taxed unrealised gains as they accrued). Supporting regulations and ATO guidance still fill in reporting detail, including an optional CGT cost-base adjustment for SMSFs so pre-1 July 2026 accruals can be carved out when assets are later sold. Earnings on assets below $3 million stay on the ordinary 15% accumulation / 0% retirement-phase rules. The levy is deliberately narrow. Most households planning around median balances will never see it. Households that do need to treat it as a recurring cash-flow line, which is why the 30-year Division 296 plan article models it inside a full retirement path rather than as a one-year spreadsheet cell.
What the distribution does not decide for a household
National tax-expenditure charts answer a fiscal question. They do not tell a 55-year-old on $95,000 whether salary sacrifice still improves after-tax wealth inside the concessional cap, or whether a low earner should chase the co-contribution and LISTO settings that actually exist for them. Those are personal-advice questions. The charts do explain why Budget fights feel so lopsided: a flat-rate system on rising balances will always look regressive in dollar terms even while compulsory SG is spreading coverage down the income scale.
They also sit beside the adequacy debate. Median balances near retirement still sit well below comfortable ASFA lump sums for many individuals, while a minority of large accounts collect most of the earnings concession. Super as compulsory saving is broad. Super as a tax shelter for very large balances is concentrated. Collapsing those two stories into one slogan is how the public argument stays stuck.
One planning implication, without a policy prescription: if your household is nowhere near Division 293 or Division 296 thresholds, the Budget argument about “who benefits” is background noise. Model Age Pension, drawdowns, and sequence risk for your own balances. If you are near or above the large-balance thresholds, the earnings concession is no longer a fixed 15% / 0% story forever, and the levy needs to sit inside the multi-decade cash-flow, not in a separate tax note.
Official sources
- Treasury: 2025–26 Tax Expenditures and Insights Statement
- Treasury TEIS 2025–26 PDF (distribution charts for contributions and earnings)
- Treasury Laws Amendment (Building a Stronger and Fairer Super System) Act 2026 (Division 296)
- ATO: About Division 296 tax for SMSFs
- ATO: Division 293 tax
- Grattan Institute: Super savings (independent distribution analysis)
Put your own balance on the chart
Treasury maps the national distribution. The Advanced Calculator maps your household: Age Pension year by year, large-balance tax if it applies, and income under harsh historical starts. Start from the ordinary-balance scenario above, then change the inputs. The first Advanced runs are free. Unlimited historical runs and PDF exports are $149 a year, or $14.99 a month if you would rather not commit upfront.
Run the ordinary-balance scenario →No card required for the first run. Subscribe only if you keep using the full model.
General information only. This article is educational and does not consider your objectives, financial situation, or needs. It does not recommend that you change contribution levels, open or close a fund, restructure balances, or take any particular tax position. SuperCalc Pro Pty Ltd does not hold an Australian Financial Services Licence (AFSL). Tax expenditure estimates, contribution caps, Division 293, Division 296, and LISTO settings change. Seek advice from a licensed financial adviser, tax agent, or accountant when personal recommendations are required, and verify current figures with Treasury, the ATO, and the Federal Register of Legislation.